
Market Outlook #119 (5th April 2021)
Hello, and welcome to the 119th instalment of my Market Outlook.
In this week’s post, I will be covering Bitcoin, Ethereum, BitTorrent, Tron, Zilliqa, The Graph, Nano, Kava, Orchid and Utrust.
As ever, if you have any suggestions for the next post, feel free to leave them in the comments below.
Bitcoin:
Monthly:

Weekly:

Daily:

Price: $57,501
Market Cap: $1.077bn
Thoughts: Despite a couple of healthy corrections, the first quarter of 2021 closed out at near-enough all-time highs for BTC, opening up the likelihood of expansion in Q2.
If we begin by looking at the monthly, we can see that March closed at $58,800, only ~$3,000 (or ~5%) off the all-time high at $61,788. It goes without saying that that is not how tops form, particularly given that with the closing of March, we also closed out Q1 as a period of significant expansion beyond the previous cycle’s all-time high. As such, I am confident that Q2 will see further expansion beyond the current all-time high. If we look at volume, we have seen declining volume for three months straight, but this is nothing out of the ordinary; in fact, if we look back to 2017, we saw a similar period of declining volume on Coinbase whilst prices pushed higher – it was not until the final three months of the cycle that we saw rapidly growing volume into the all-time high at $20k , where volume also peaked. This may be something to keep an eye on, for those who are intent on nailing ‘the top’; if we see another period of rapidly growing volume wherein monthly volume far exceeds the levels seen earlier this year, we might well be trading into the cycle peak. Looking ahead, there are plenty of minor resistance levels based on traditional Fib extensions, but I am particularly interested in the 500% extension of the cycle at $87k as an area to take plenty of spot profits. Beyond that, if thrill becomes euphoria above $87k, we could plausibly see the 1000% extension at $171k tagged, but – if I’m honest – I will not be hanging around awaiting such prices for the majority of my spot. I am very much of the mind that we are now entering the latter stages of the crypto market cycle and I will be looking to lock in the majority of my returns within the next 3-4 months.
Turning to the weekly chart, price is still consolidating below that all-time high and holding above trendline support from October, and I’d expect to see a breakout beyond $62k in the next week or two. Following that, should the weekly close above the all-time high as opposed to wick above and close back inside, I’d be looking for continuation into $64k followed by the 400% extension at $70,500. Again, as was the case last week, the new swing-low formed at $50,300 should hold firm, so as long as we are above that I see no reason to expect downside; break and close below that and we have some issues.
Turning to the daily, price has been in a tight range inside the larger range for several days now, coiling around the prior range resistance at $57,800. Volume has also been dropping off significantly, to near enough the lowest levels traded daily in the last several months. This is indicative of an explosive move sooner rather than later; consolidation leads to expansion. If we do see the upside breakout I am expecting, I’d want to see a firm close above $62k to confirm bullish continuation. A stop hunt and close back below the high would be quite bearish. Let’s see how the next week or so plays out…
Ethereum:
ETH/USD
Weekly:

Daily:

ETH/BTC
Weekly:

Daily:

Price: $2064.95 (0.0355 BTC)
Market Cap: $238.178bn
Thoughts: Ethereum finally delivered the goods, almost precisely as expected, and we now find ourselves with ETH/USD in price discovery.
Beginning with the dollar pair, if we look at the weekly, we can see that price closed the week firmly above the prior all-time high on higher volume than the preceding two weeks, confirming the breakout. The pair pushed into $2146 before closing at $2076, with the 1.618 extension of the bear market at $2242 only a stones throw away at this point. Given the strength shown here, I would expect to see a period of expansion follow into that $2750 area. Looking at the daily, we can see that the pair closed the daily above that prior high and has since been consolidating above it, having also made a higher-high on RSI, indicating a momentum shift. If we look at fib extensions of the current range, the 200% extension roughly aligns with the 200% extension of the bear market, providing confluence for an area of resistance to form there. Prior to that, extension into $2500 will likely provide some resistance, as it is both a psychological figure and the 1.618 extension of the range. As long as ETH/USD holds above $1546 from here (the higher-low), bullish market structure will remain intact, so I would not worry if we do see any minor correction from here.
Turning to ETH/BTC, the pair reacted exactly as I hoped it would following the sweep of 0.03, with price rallying throughout the week and closing the weekly back above 0.0351 on higher volume for the first week since February. This confirms 0.03 as a higher-low for me, and I would expect at the very least for the pair to go on and retest the 2021 high from here, although regular readers will know that I have been looking at 0.054 as a key level for some time now. Turning to the daily, the close firmly above 0.0351 confirmed the reversal of market structure, along with the higher-high on RSI, and I’d like to see this level now hold as support, with the next area of resistance coming in at 0.0375, followed by the 2020 high at 0.0406.
BitTorrent:
BTT/USD
Weekly:

Daily:

BTT/BTC
Weekly:

Daily:

Price: $0.0127 (22 satoshis)
Market Cap: $12.615bn
Thoughts: BitTorrent has been on a tear for several weeks now and it may well be time for holders to begin considering position management.
If we begin by looking at BTT/USD, from the weekly we can see that the pair broke above its prior all-time high at $0.00185 earlier this year, initially rejecting, before consolidating and breaking out. Since, it has rallied every week, closing at new all-time highs each week and now extending beyond the 500% extension of its entire price-history, with price now within spitting distance of the 1000% extension at $0.0172. Interestingly, it has been rallying on declining volume with each passing week since testing its prior all-time high, with volume now approaching the lowest levels since pre-September 2020, where it appears a volumiser may have been turned on for the pair on Huobi. Regardless, the 1000% extension is, in my opinion, a good area to look to take profits for those that have yet to, as downside risks from here begin to far outweigh upside potential, particularly in the context of a $12.6bn market cap and – if it does reach $0.0172 – a 140x return since March 2020. If we look at the daily, the consolidations between legs higher have been decreasing in duration, which is often the case in parabolic moves, and I would expect to see a blow-off top begin to form over the next couple of weeks at this rate.
Turning to BTT/USD, the pair has recently traded into an area of significant resistance between 21 satoshis and the all-time high weekly close just shy of 24 satoshis, providing confluence for an area of profit-taking. If the pair does extend beyond this cluster of resistance, there is thin price-action between 24 and the all-time high around 33 satoshis, so I would expect that high to be taken out swiftly afterwards, which may well be the blow-off top. Unlike the USDT pair, volume is still elevated here, which may suggest there is some steam remaining. Nonetheless, if I had been a late 2020 – early 2021 buyer, this would be my primary profit taking area, with more sells placed around the all-time high and slightly beyond. It goes without saying that you should not be considering buying BTT up here.
Tron:
TRX/USD
Weekly:

Daily:

TRX/BTC
Weekly:

Daily:

Price: $0.14 (238 satoshis)
Market Cap: $9.942bn
Thoughts: Given the rally occurring in BTT, it comes as no surprise that Sun’s flagship project is now picking up the pace.
If we look at TRX/USD, we can see from the weekly that price closed firmly above the complacency resistance from the previous cycle around $0.10. The pair has since continued higher this morning, trading into a new yearly high at $0.145. RSI is at all-time highs, unsurprisingly, but continues to make higher highs on the weekly, indicating that momentum is strong here. I would expect to see Tron now close the gap between here and the all-time high weekly close at $0.205 over the next couple of weeks, followed by the all-time high at $0.36 should it manage to close the weekly above $0.21. For buyers, any retest of the $0.10 – should it come – is a gift, but I doubt those on the sidelines will get such a perfect entry.
Turning to TRX/BTC, the pair has finally reclaimed several levels of prior support, closing last week above range support at 134 satoshis and minor support at 168 on the highest volume since September 2020. This confirms the macro reversal for the pair, with 306 satoshis likely to provide some resistance above. However, should price crack that level, I’d imagine that the wick into 475 will be filled in soon afterwards, with no real resistance above that all the way into 865 satoshis. If we look at the daily, the pair has reclaimed the 200dMA and 360dMA confluence, and is now trading into minor resistance at 260 satoshis, where we may see some consolidation occur, particularly given that daily RSI is now as overbought as it was in September 2020. If we do see price begin to consolidate below 260 and RSI dip, I’ll be looking to add to my spot position prior to the next leg higher.
Zilliqa:
ZIL/USD
Weekly:

Daily:

ZIL/BTC
Weekly:
Daily:

Price: $0.22 (378 satoshis)
Market Cap: $2.462bn
Thoughts: After around a year of holding my position in ZIL, we have finally come within spitting distance of its all-time high against the Dollar, and I’d expect to see some parabolic price-action once it enters price discovery.
Beginning with ZIL/USD, we can see that price closed at the highest weekly close of all-time last week, a couple of cents short of the all-time high at $0.236. Unsurprisingly, I would expect that we see new all-time highs this week (or next week, at the very latest), with my primary target for profit taking at the 1.618 extension around $0.372. The parabolic advance remains intact as the rally is gradually steepening and I am expecting to see much sharper price-action before the peak, as it has been a very steady climb over the past year for the most part. Beyond the 1.618, my highest price target that I think is plausible in these market conditions is the 2.618 at $0.60, which would put ZIL at roughly a $7.5bn market cap – by this point, I will have exited my entire position. Turning to the daily, following the gradual climb and consolidation periods, there is now plenty of upside for RSI prior to extreme overbought conditions, just as the pair approaches price discovery, which is ideal. Resistance levels continue to be flipped as support, maintaining bullish market structure, and we are now potentially just a day’s price-action away from price discovery.
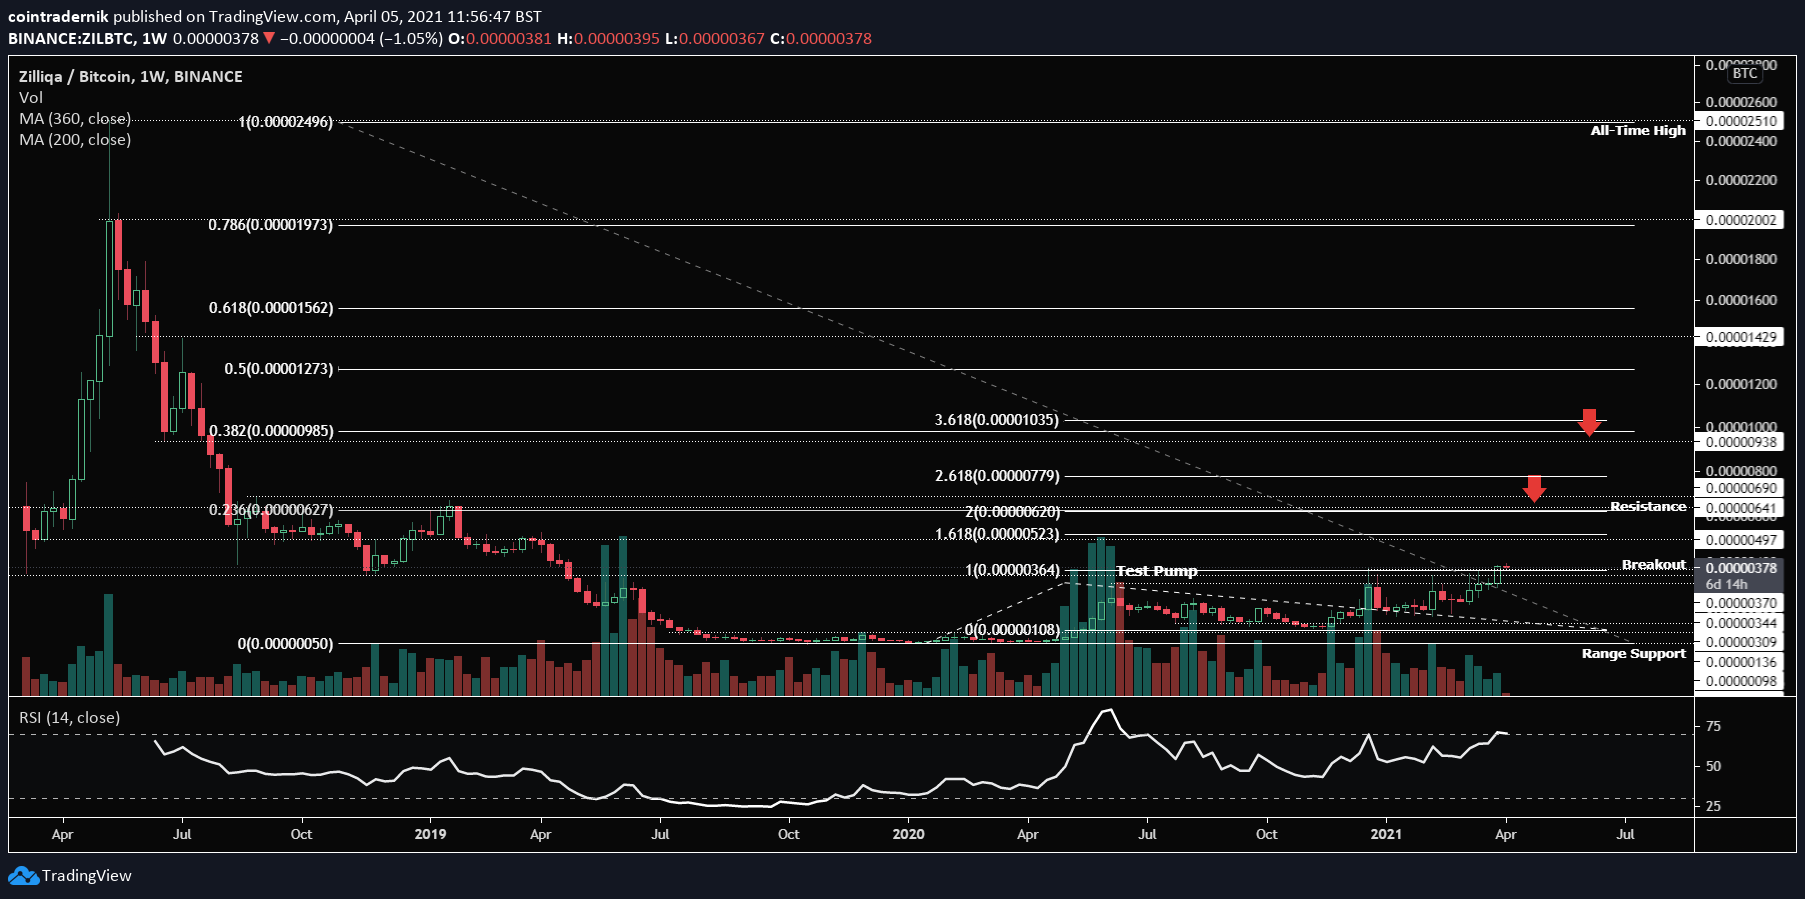
Turning to ZIL/BTC, we can see here that for the first time since mid-2019, ZIL has closed the weekly above the historical pivot around 370 satoshis; the level that formed the base for the first bull cycle in 2018. Now that this level has given way, I would expect to see swift continuation into the first fib retracement level of the bear market at around 627 satoshis, which has confluence with the 200% extension of the current bullish trend. This is my first target for profit-taking and roughly aligns with the 1.618 extension for ZIL/USD. Though it is within the realms of possibility that we see the pair experience another cycle like early 2018, I do not think it is wise to hold in anticipation of that (i.e. a run beyond 1000 satoshis, where my second and final profit taking spot resides) because of the implications for ZIL’s market cap. Of course, it is possible that it becomes a $10bn+ project, but I am here to capture the bulk of the cycle, not anticipate the top. If you have been holding ZIL since the original range above 50 satoshis, then you too would be capturing the bulk of the cycle by beginning to sell above 600; for those on the sidelines, this last weekly close was the trigger for capturing the next leg into 600, with a stop on a weekly close below last week’s low. It has been a great run, but I do believe we are now entering the latter stages of the market cycle for ZIL (which are bound to be the most parabolic, of course).
The Graph:
GRT/USD
Daily:

GRT/BTC
Daily:

Price: $1.81 (3101 satoshis)
Market Cap: $2.256bn
Thoughts: If we begin by looking at GRT/USD, we can see that price made an all-time high at $3 in mid-February before beginning a consolidation period, where $1.30 has now become support and $2.34 an area of resistance. The pair has recently broken above trendline resistance from the all-time high, indicating a potential trend reversal and continuation higher; however, I would be looking for a daily close above this cluster of highs at $1.96 before entering a position, with a stop at $1.30 following that break higher and a first target of the all-time high at $3. Should GRT extend beyond that high, the next area of interest is the 1.618 extension at $4.07.
Turning to GRT/BTC, a similar pattern of price-action is present due to the limited price-history available, but we can see that the pair has been coiling and tightening its range since dropping into prior resistance turned support at 2450 satoshis. This level has held firm and price is now consolidating below support turned resistance at 3300 satoshis; if we see the pair cable to close above that level, that would indicate to me that GRT is ready for an all-time high retest at 6100, providing a high R setup with a stop on a daily close below 2450.
Nano:
NANO/USD
Weekly:

Daily:

NANO/BTC
Weekly:

Daily:

Price: $5.37 (9199 satoshis)
Market Cap: $716.037mn
Thoughts: Beginning with NANO/USD, we can see from the weekly that Nano is further behind in its market cycle than other projects of its age, with its currently contesting the prior support turned resistance cluster around $5.71, which had led to capitulation following its fall in May 2018. If the pair can close back above this level, that would be a clear signal that it wants higher prices, with no real resistance between the current yearly high at $8.40 and the May 2018 wick at $11.10. Beyond that, the primary resistance ahead will be the $18 area, where holders should probably look to begin taking profit on long-held spot positions. For bears, any weekly close below the current higher-low at resistance turned support ~$3.79 would be ugly, indicating that the move above this area has been a deviation, with the next support below at $2.04.
Turning to NANO/BTC, the pair has been capped by support turned resistance at 1250 satoshis since July 2019, so unsurprisingly this is the level I would be watching for an entry trigger to capture the next leg higher. If we see the weekly close above this level, I would look at buying spot with a stop below 750 satoshis and an initial target of 2200 satoshis, followed by 3570 satoshis. The reason for this stop can be seen more clearly on the daily, where there is a cluster of supports that have confluence with the 200dMA and 360dMA at present; there should be no reason for the pair to fall below that area if it is bullish.
Kava:
KAVA/USD
Weekly:

Daily:

KAVA/BTC
Weekly:

Daily:

Price: $7.75 (13,260 satoshis)
Market Cap: $453.912mn
Thoughts: If we begin by looking at KAVA/USD, we can see from the weekly that the pair has been consolidating above its prior all-time high at $5.81 for several weeks at this point, having failed to close above the level on the initial breakout but having since rallied into $7.55 and retested the prior high as support. This is perfect for trend continuation, in my opinion, with the next resistance above at the 1.618 extension around $8.73; beyond that, I’m looking at $10 and $13.44. If we drop into the daily, we can see how price has interacted with that prior high more clearly, having printed bearish divergence following the ATH breakout but having since consolidated, formed a higher low at $4.20 and rallied to a new al;-time high. I’d like to now see RSI print a higher high to confirm the momentum shift and open up further upside. Whilst that $4.20 low remains intact, I expect the uptrend to continue.
Turning to KAVA/BTC, the pair has only just managed to close above 10.7k satoshis, which capped price for several months. There is now a large gap between here and the next major resistance at 17.3k satoshis, which I am expecting to be filled over the coming weeks. If we look at the daily, the traded setup here for those on the sidelines would be to buy the daily close above the 360dMA with either a tight stop loss on a daily close back below 12k or, for those that require more breathing room, at 8600 satoshis). The first target is that cluster of resistances around 17.3k to 19.4k satoshis, but if KAVA can get above that, there is only air all the way up into the July 2020 resistance around 30k satoshis. However, if the pair fails here and closes back below 8600, the next support is another 25% lower at 6200, and the short-term trend of higher-lows will have been broken.
Orchid:
OXT/USD
Daily:

OXT/BTC
Daily:

Price: $0.94 (1615 satoshis)
Market Cap: $346.915mn
Thoughts: Orchid has been around for a little over a year now and it is on the cusp of price discovery against the Dollar.
If we look at OXT/USD, the pair is printing a new all-time high on near-ATH daily volume at present, breaking through $0.98. If it can close above $1, there would be some trendline resistance above around $1.22, but beyond that the next fib extension is at $1.53. For those on the sidelines, buying a daily close above $1 makes sense to me, with a stop on a daily close below $0.71, which should hold as support. I actually think this can rally significantly beyond its 1.618 extension, as it has never really experienced a full bull cycle beyond the sharp swift one in August 2020.
If we look at OXT/BTC, we can see this more clearly, where the pair rallied from support at 1430 satoshis into 8k satoshis within a few days in August, only for the following months to lead to new all-time lows at 643 satoshis, with that 1400-1600 satoshi area now acting as resistance, with the 360dMA as confluence above at 1900 satoshis. If the pair can overcome this cluster of resistances, I’d expect to see a full reversal back into the August highs, much like we have seen on many other alts recently. This is one I am keeping a close eye on at present to begin reallocating capital from overextended positions.
Utrust:
UTK/USD
Weekly:

Daily:

UTK/BTC
Weekly:

Daily:

Price: $0.67 (1137 satoshis)
Market Cap: $298.919mn
Thoughts: Utrust remains one of the most fundamentally-sound projects in the space and it appears to be trading as a slight laggard to ZIL on its Dollar pair.
If we look at UTK/USD, we can see this quite clearly, with the pair recently trading into its all-time high weekly close at $0.80 and now consolidating below it, having flipped recent range resistance at $0.53 as support, in a similar manner to ZIL. If we can get a weekly close above $0.80, I’d expect the next few weeks to take it towards its all-time high at $1.45, but – as I have expressed in prior posts – I fully expect UTK to extend beyond this high into the 1.618 at $2.40 at the very least, which is my primary profit-taking area should we get it.
Looking at UTK/BTC, we again see many similarities to ZIL, albeit with the historical pivot at 1165 satoshis not being quite as unforgiving as the 370 level has been for ZIL; in fact, in August 2020, UTK extended beyond it into 2000 satoshis before returning to form a higher low at 450 and now looking to reclaim the pivot as support. If we see 1165 give way again, I would be looking for expansion into 2k to follow, with the 1.618 extension beyond that high falling at prior support turned resistance around 3000 satoshis, which is another important area for me moving forward for position management. Beyond that, I would not be surprised to see the pair extend towards the all-time high weekly close at 5500 satoshis in these market conditions, should it manage to close the weekly above 3k.
And that concludes this week’s Market Outlook.
I hope you’ve found some value in the read and thank you for supporting my work!
As ever, feel free to leave any comments or questions below, or email me directly at nik@altcointradershandbook.com.


Hi Nik, thanks for your content and calls. How do you see this recent price action on BTC (coinbase news maybe) affecting ZIL? Are you still confident in it hitting the targets you mentioned above? (627 sats / 0.372usd) Thank you!
Included in today’s post for you, and no worries!
Hey Nik,
I just started considering investing in a lot of the more obscure Altcoins (I have a fair amount of ETH a couple others), but it seems that since we’re nearing the end of the bullrun, it doesn’t seem like I should focus a lot of efforts on investing in ones that certainly seem to be going parabolic. Are there any that are not that you’re going to be covering? Also, is my logic off?
Hi Nik, thanks for the report. I was wondering if you could give an update on SC next week. It broke out of the multiyear channel and hit your first target (65 sats) but is currently retracing to at, or below the breakout point. I was wondering when trend continuation to 100+ sats would be completely invalidated. Thanks!
Hey Benne,
Absolutely, will do.
Could you please cover $XRP as well? or in short can you provide some analysis on it before the next market outlook release?
I will make sure it is included on Monday!
Nik, your reports are invaluable. Thank you for offering this service to us at such a reasonable price!
No problem, glad you find some value in them!
Nik,
1. Thanks for the Market Outlook!
2. I think for NANO you missed some zeroes:
“Turning to NANO/BTC, the pair has been capped by support turned resistance at 1250 satoshis since July 2019 […]” -> shouldn’t it be 12.5k satoshis?
“[…] I would look at buying spot with a stop below 750 satoshis and an initial target of 2200 satoshis, followed by 3570 satoshis.” -> 7.5k satoshis, 22k satoshis, 35.7k satoshis?
3. You wrote “I am very much of the mind that we are now entering the latter stages of the crypto market cycle and I will be looking to lock in the majority of my returns within the next 3-4 months.”. What in general is your exit strategy for this crypto bull cycle? Are you going to eventually sell ALL of your crypto for fiat/stablecoin and wait for the market to cool down before entering again? Or you will not wait and just start shorting stuff? A post about that – or at least a comment – would be valuable.
Hey,
No problem! Yes I appear to have missed a couple of typos. Thanks – will update those.
Regarding exit strategy, I am focused primarily on my alts hitting their ALT/BTC targets and now I am generally storing returns as BTC as opposed to reallocating everything into new positions. This will continue for a while whilst the altcoin market remains frothy. Following that, I will be looking to ride the majority of my portfolio in BTC (likely into Q3), looking for parabolic price-action there. My final exit will be into stablecoins following that and I will then wait several months before reassessing! I won’t be looking to short anything except in my intraday trading (no longer-term shorts).
Hope that helps.
Thanks for the reply – very helpful indeed!
As for the stablecoins: do you have any preference? USDT? USDC? BUSD?
It seems Tether is still the most common one, despite all the theories around it.
I think it is just personal preference really – I like USDC or USDT.