
Market Outlook #254 (5th February 2024)
Hello and welcome to the 254th instalment of my Market Outlook.
In this week’s post, I will be covering Bitcoin, Ethereum, Mina Protocol, Oasis Network, DIA, Perpetual Protocol, Raini Studios Token and XALPHA.AI.
As ever, feel free to comment with any requests for next week, or shoot me an email.
Bitcoin:
Weekly:

Daily:

Price: $43,104
Market Cap: $847.456bn
Thoughts: If we begin by looking at BTC/USD on the weekly timeframe, we can see that price closed last week marginally back above the $42k area, wicking towards $44k initially but rejecting below that resistance. Volume declined on the prior week, and we continue to consolidate around this level in early trading this week. Not much has changed in my view since the prior week: we still have a deep wick below a cluster of support followed by a show of strength from bulls, and until we either lose that $39.7k support or close the weekly above $45k, I am not particularly interested in price-action.
If we drop into the daily, we can see how price has been consolidating in a tighter range for the past few days, having spiked up into $44k and then spent most of last week holding firm above $42k. From here, either we follow the original trajectory marked out, whereby we form a lower-high below $45k (which may well be in), break back below $40k and continue lower towards the cluster of support below, somewhere between $33-36k; or, if bulls are really in control here and that spike into $38k was all we’re getting, price should form a higher-low above it this week and then rally through $45k – any acceptance above that level would signal the end of this consolidation period and therefore continuation higher towards all-time highs. I think this week is likely to show that path ahead..
Ethereum:
ETH/USD
Weekly:

Daily:

ETH/BTC
Weekly:

Daily:

Price: $2321.93 (0.05386 BTC)
Market Cap: $279.341bn
Thoughts: Looking at ETH/USD, on the weekly timeframe we can see that last week was indeed a consolidation week, with price still sandwiched between $2156 as support and $2425 as reclaimed resistance. Again, much like BTC, whilst we remain in this range, there is little to pay attention to; if the bearish divergence is to play out, we should see acceptance below $2156 soon, leading to that deeper retracement towards the 200wMA and $1850 support; if, however, price pushes higher here and is able to turn that $2425 level into support, that would invalidate this divergence and open up another leg higher towards the mid-$3k region. Dropping into the daily, there is not a huge amount to add here but we do have some hidden bullish divergence with momentum making a lower low but price failing to do so. We also have the beginnings of a return to bullish market structure, but that will not be true until that $2425 level is flipped as support, after which we can look for high-probability longs through $2650 towards $3300 as a first target.
Turning to ETH/BTC, there is very little to add here on last week’s analysis, as price spent the entire week in a very tight range between support at 0.0533 and prior range support at 0.055 once again acting as resistance. This is the level bulls want to see flipped here and become support again, opening up that long-term trendline retest and likely a successful breakout this time. If 0.0533 falls, down we go into 0.051 to retest the support base.
Mina Protocol:
MINA/USD
Daily:

MINA/BTC
Daily:

Price: $1.19 (2757 satoshis)
Market Cap: $1.234bn
Thoughts: As both pairs for MINA are looking very similar historically, I will focus on the Dollar pair here.
Looking at MINA/USD, we can see that the pair spent the bulk of its history in a downtrend, bottoming out in October 2023 at $0.35 – 95% off the all-time highs. From that point, price rallied sharply on high volume, breaking through long-term trendline resistance before finding resistance at $0.95. Price then retraced and found support above the 200dMA and historical support at $0.55, consolidating and continuing higher from there in January into prior support turned resistance at $1.75. We have seen a similar retrace and consolidation following that high, but price is now capped once again by resistance at $1.27, having found support at that prior resistance level around $0.95. If we can close back above $1.27 and turn daily structure bullish once again, I think the third leg higher begins for MINA, with the 1.618 extension of the current trend aligning with the 38.2% fib retracement of the bear market at around $2.80. I believe that would be a logical target for the next major resistance. And as long as this now holds above $0.95, there is no reason to expect anything but trend continuation higher.
Oasis Network:
ROSE/USD
Weekly:

Daily:

ROSE/BTC
Weekly:

Daily:

Price: $0.114 (265 satoshis)
Market Cap: $767.443mn
Thoughts: Beginning with ROSE/USD, we can see from the weekly chart that following price finding resistance at $0.14 and forming the first swing-high of its new cycle, the pair has retraced for several weeks, finding support at prior resistance ~$0.088. From here, price has reversed sharply, printing a strong swing-low and rallying into reclaimed resistance at $0.115, below which it is currently sat. From here, I would expect the trend to persist, assuming market conditions do not fall apart, and so I am looking at $0.18 as the next level of interest once we can close the weekly back above $0.115. The bearish scenario is of course that price is forming a lower-high here below key resistance, from which we continue lower through $0.088 for a deeper retracement before finding a mid-cycle bottom – likely above $0.06. No way to know which trajectory at the current moment, but I think we’ll know within the next week or two…
Looking now at ROSE/BTC, we can see how following that retracement, price has returned to prior resistance from the previous consolidation at 235 satoshis and found support, now consolidating between that level and 280 satoshis as resistance. Again, the trend is still pointing up, as is weekly structure, and so if we can get back above 280, I think this continues into 420 satoshis before finding more significant resistance; if, however, this area caps price and we move below 235 again, I am looking at the range between 180-200 satoshis as a likely bottoming area before the next leg higher.
DIA:
DIA/USD
Weekly:

Daily:

DIA/BTC
Weekly:

Daily:
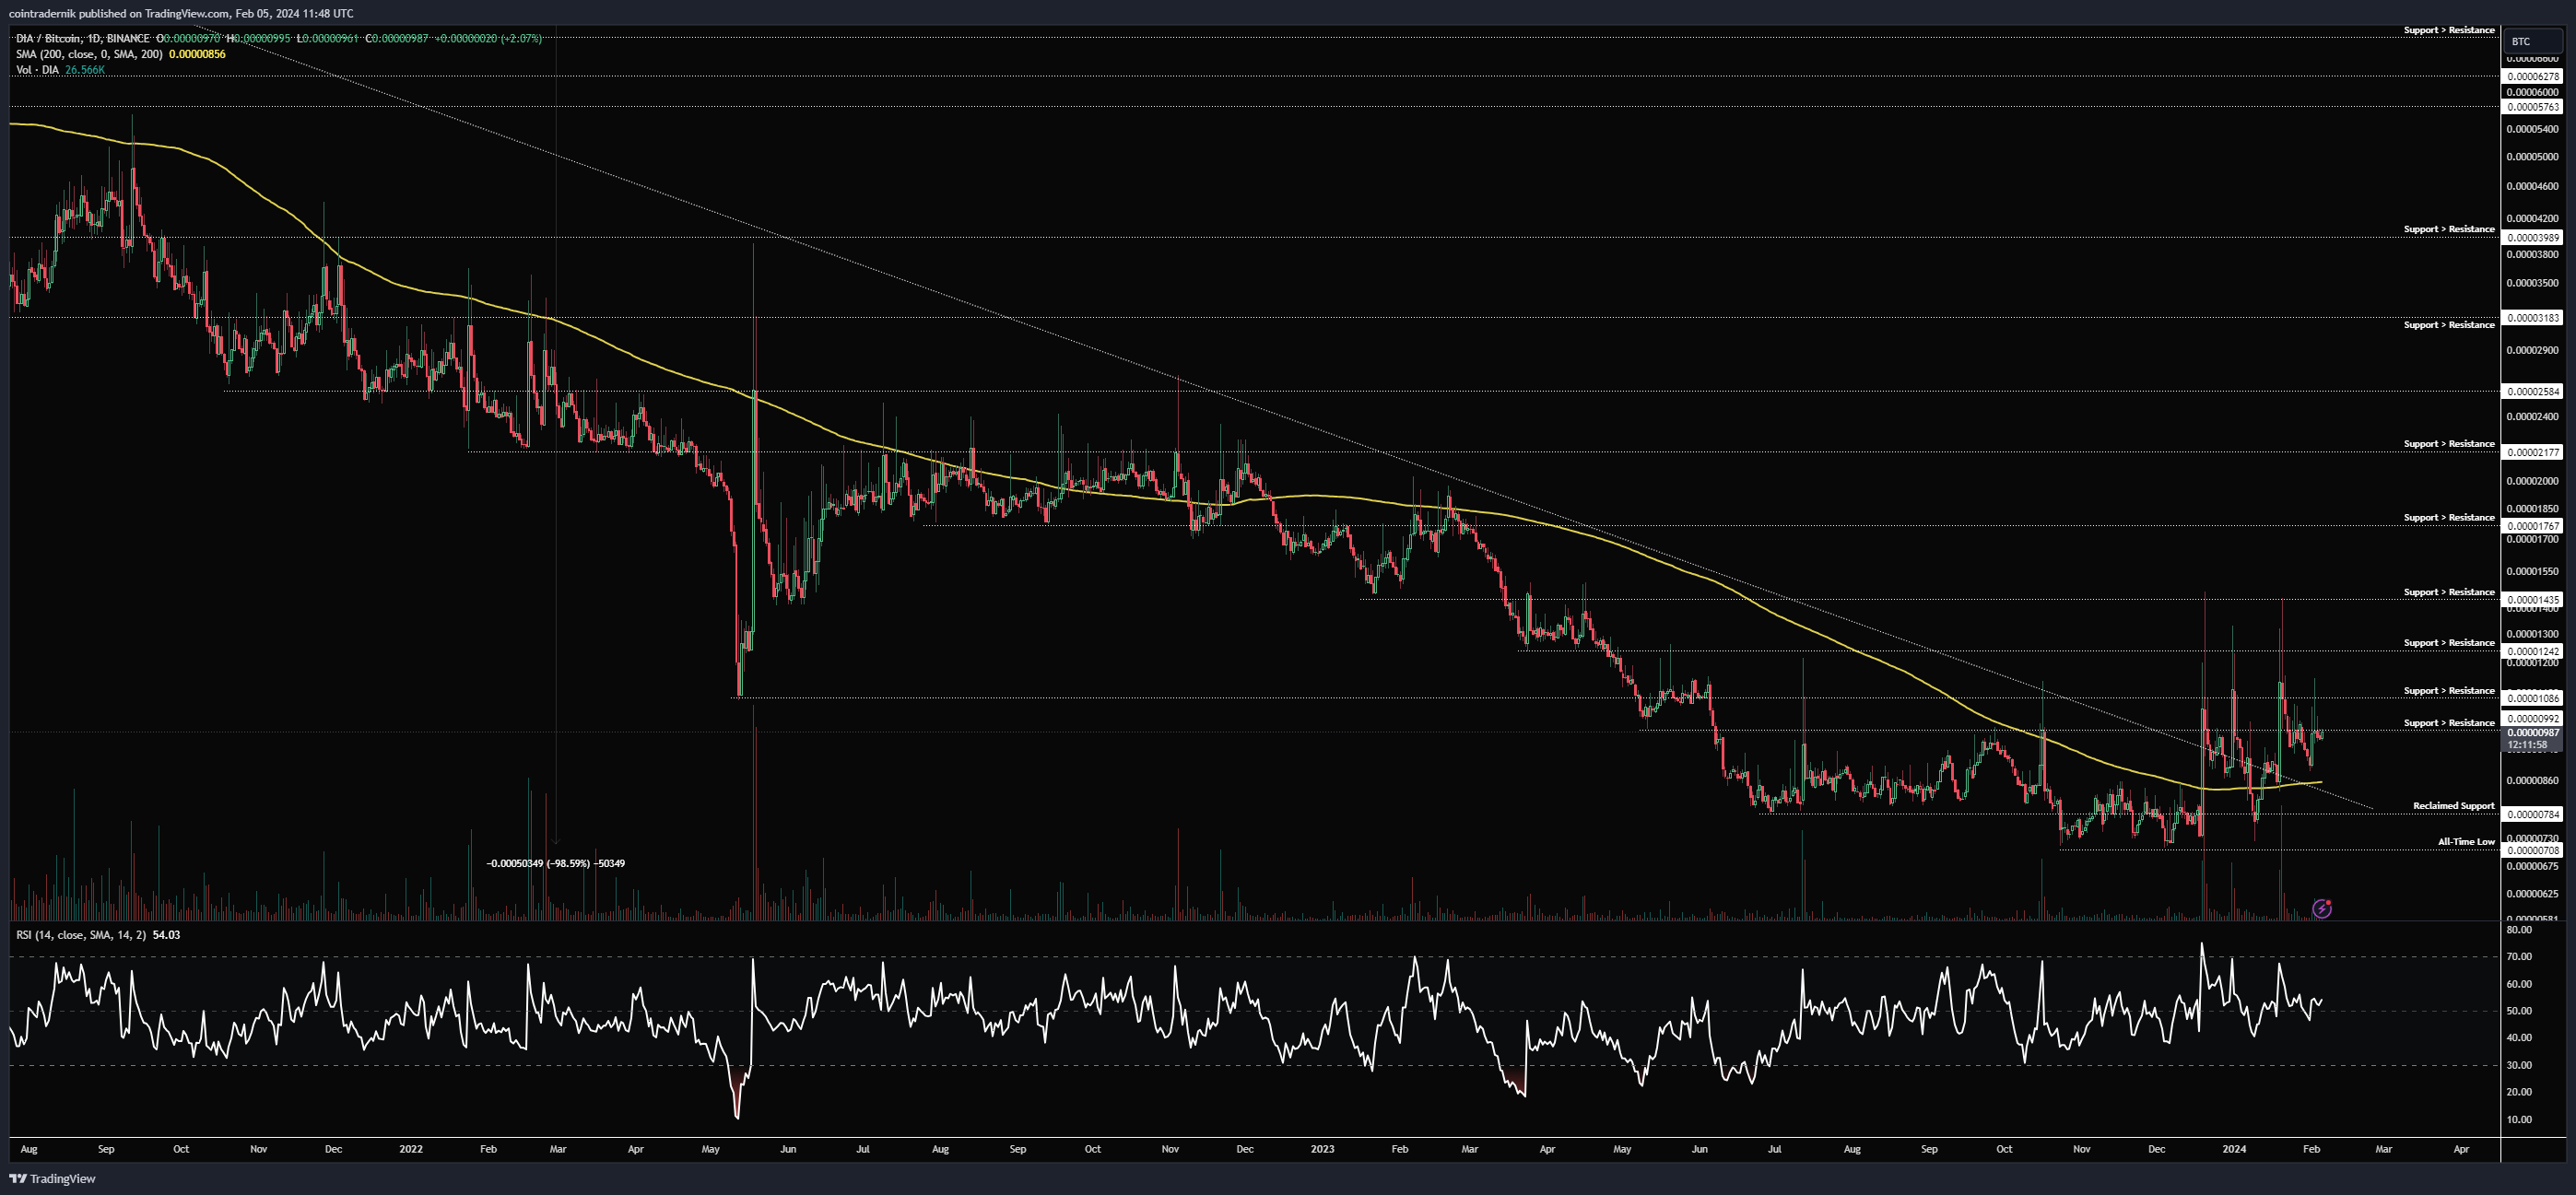
Price: $0.426 (989 satoshis)
Market Cap: $47.181mn
Thoughts: If we begin by looking at DIA/USD, we can see from the weekly chart that price has spent most of its time trending lower, only bottoming in September 2023 after forming its all-time high in May 2021. That said, price has spent 623 days capped by resistance at $0.59, forming the top of a near two-year range. For the bulk of that period, price has held above $0.30 as support. Following the all-time low, price rallied off $0.21 and reclaimed $0.30, continuing to trend higher for months, breaking back above $0.33 before rallying sharply into $0.59 but failing to close through $0.49 on successive attempts since late December. We are now consolidating between $0.33 and $0.49 with rising lows, suggesting an upside breakout once this consolidation ends; I am looking for a weekly close through $0.59 to begin the first major bull cycle for DIA, as its first one was short-lived. Disbelief kicks in above $0.78…
Turning to DIA//BTC, we can see that price broke out of a multi-year downtrend at the beginning of the year on strong volume, having formed an all-time low at 708 satoshis and found support above it for months, before trading through trendline resistance and flipping it as support. Price rallied into 1435 satoshis before rejecting, and is now consolidating above that trendline but below support turned resistance at 1100 satoshis. From here, I am expecting continuation through 1100 satoshis to lead to a push into 2177 as the next major resistance. As long as this can hold above 800 satoshis in any forthcoming volatility, I think we’re golden for trend continuation.
Perpetual Protocol:
PERP/USD
Weekly:

Daily:

PERP/BTC
Weekly:

Daily:

Price: $1.04 (2418 satoshis)
Market Cap: $75.689mn
Thoughts: If we begin by looking at PERP/USD, we can see that price faked out above 553-day range resistance, rallying into $2.22 before rejecting in January, closing back inside that range resistance. From there, price has spent a few weeks retracing, now holding above reclaimed support at $1.04. Despite momentum and structure here still looking strong, this level is looking a little precarious; if it gives way, I would expect the range between $0.70-0.81 to mark out the next higher-low from which price will continue higher to the first target of this cycle at $3.60. If we drop into the daily, we can see that daily structure is very much bearish, and momentum is not yet indicating exhaustion of this move lower. The 200dMA is also sat right between that range mentioned previously, providing confluence for a bottom in that area should we not see the pair hold above $1 here. Long-term, I am expecting much higher prices later in 2024 and early 2025.
Turning to PERP/BTC, we can see that price has retraced below prior support at 2600 satoshis, having failed to close through the major support turned resistance level at 3600 satoshis on multiple attempts. We are now in no man’s land, with major support below between 1940-2140 satoshis, aligning with our Dollar pair analysis. I am expecting the formation of a higher low in that region, with trend continuation through 3600 satoshis the primary signal for acceleration of PERP’s next bull cycle. I have marked out how we might get there in 2024, with much of the pre-April price-action expect to be further consolidation and formation of higher-lows, with new yearly highs through 5200 satoshis in Q2.
Raini Studios Token:
RST/USD
Weekly:

Daily:

RST/BTC
Weekly:

Daily:

Price: $0.03 (71 satoshis)
Market Cap: $30.257mn
Thoughts: Looking firstly at RST/USD, we can see that price marked out a mid-cycle high in December at $0.077 and has retraced heavily from there, bleeding 73% off that high all the way into trendline resistance turned support at $0.0207, aligning with the 78.6% fib of the entire uptrend. Price rallied sharpy off that level, forming a reversal candle, which was confirmed last week with price continuing to rally into the weekly close at $0.031. We are now sat at that level, and I would expect to see the formation of a higher-low above $0.02 in the next few weeks, leading to continuation of the trend, through resistance at $0.049 into $0.077 and beyond towards fresh all-time highs…
Turning now to RST/BTC, we can see that price retraced also to the 78.6% fib on this pair at 55 satoshis, before bouncing above that multi-year reclaimed support level and now sitting above 62 satoshis but below prior support turned resistance at 85. Above 85, I think we see acceleration higher into 137 satoshis as major resistance, with acceptance above that making it very clear we’re gunning for fresh yearly highs through 180 satoshis. I am still very much looking to hold this for a cycle, with fresh all-time highs and price discovery on the cards. If we look briefly at the daily, we can also see that price bounced off the confluence of the 360dMA and 200dMA, so as long as this range can now hold as support I think we’re getting ready for the next phase of the cycle. Test pump complete.
XALPHA.AI:
XALPHA/USD
Daily:
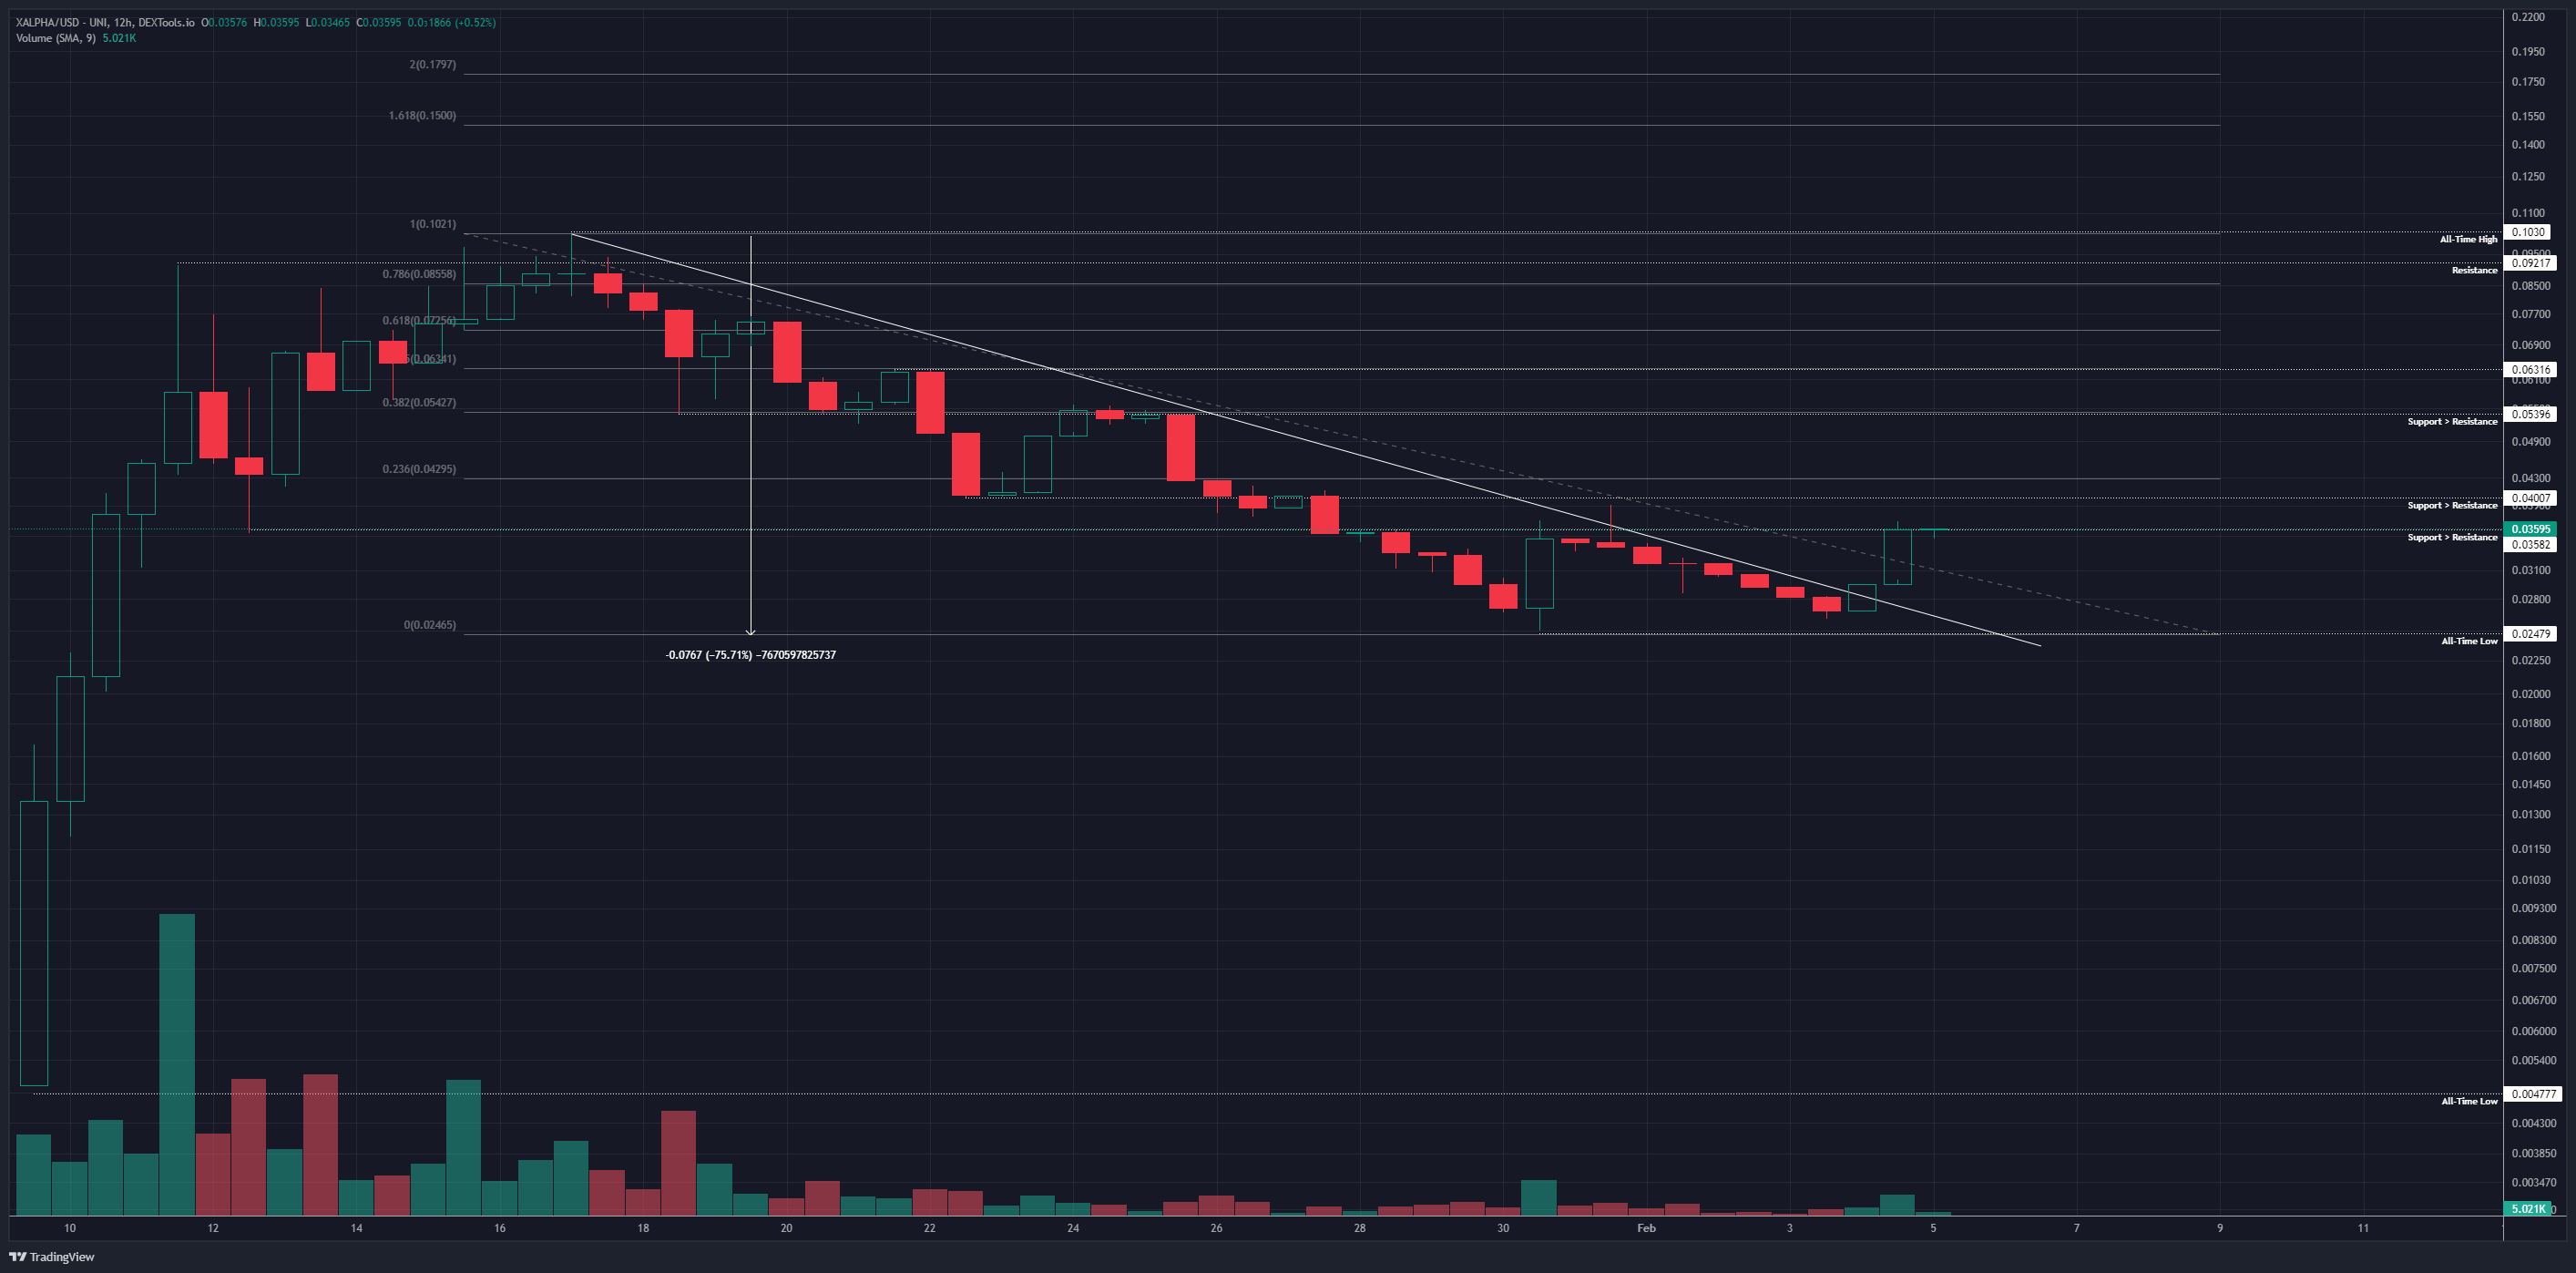
Price: $0.0357 (83 satoshis)
Market Cap: $2.51mn
Thoughts: XALPHA.AI has only been trading for a few weeks but I believe it is a promising project, hence its inclusion here. Price rallied sharply after inception, marking out an all-time high at $0.10 in mid-January, before beginning its first major retracement, drawing down 76% off that high and finding support at $0.25. Price rallied off that level in late January, faked out through trendline resistance from the all-time high, but ultimately formed a higher-low above $0.25 early this month. We are now back above trendline resistance and contesting prior support at $0.36. Close through $0.40 and reclaim that level as support and I think the bottom is in and we continue the trend higher towards $0.18. I have bought some between $0.25-0.36 and will continue to buy if this moves below that support level, as this is very much a microcap and hence I’m in for moon-or-die.
And that concludes this week’s Market Outlook.
I hope you’ve found value in the read and thank you for supporting my work!
As ever, feel free to leave any comments or questions below, or email me directly at nik@altcointradershandbook.com.