AD: Before I begin this post, I’d like to briefly mention Bitcoin.Live, who are sponsoring my blog.
Bitcoin.Live offers regular, detailed content on their free-to-access blog, created by a panel of analysts (including Peter Brandt), and covering all manner of market-related topics. I found both the video material and the blog posts to be genuinely insightful, with many differing analytical perspectives available for viewers and readers. The platform also offers premium content for paying subscribers who find value in the free material, with daily videos, alerts and support provided. Check it out and bookmark the blog.
Market Outlook #35 (12th May 2019)
Well, we’ve had a wild week.
In today’s Market Outlook, I’ll be analysing the past week’s price-action in Bitcoin, Monero and Ethereum. There’s quite a lot to cover, as you might expect, so let’s crack on:
Bitcoin:
Weekly:
Daily (1):
4H:
Shorts/Longs Ratio:
Daily (2):
1H:
Price: $7132
Market Cap: $126.209bn
Thoughts: There’s really very little point in harking back to last week’s Market Outlook, because this past week Bitcoin has blown all expectations of bears and bulls alike out of the water. I will say that, whilst I began last week expecting one final leg up before a drop, I certainly did not expect what has occurred; at least not until I did some further analysis, as I shall come to a little later. If you’d like to bypass all the following analysis and skip straight to an explanation of what’s happened this past week, read my thread from Twitter.
Let’s begin with the Weekly chart:
Following the breakout from trendline resistance and range resistance at $4100, Bitcoin jumped up towards $5200 and consolidated. The week before last saw the Weekly close poised beneath the $6000 supposed resistance. “Resistance, what resistance might that be?” exclaimed Big Daddy Bitcoin as it spent the past 7 days rallying over $1500 towards $7500. Indeed, it has been a magnificent week for BTC. If Bitcoin can hold above $7000 for the Weekly close, one could make the case that the $6k resistance has been reclaimed as support, but that’s many hours away and, as we will see from the lower timeframe charts, it does appear the local top is in.
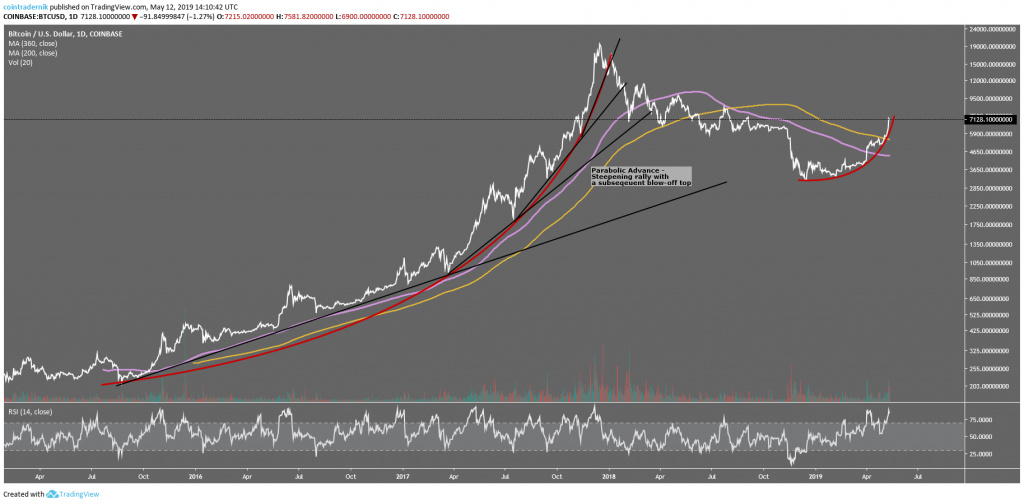
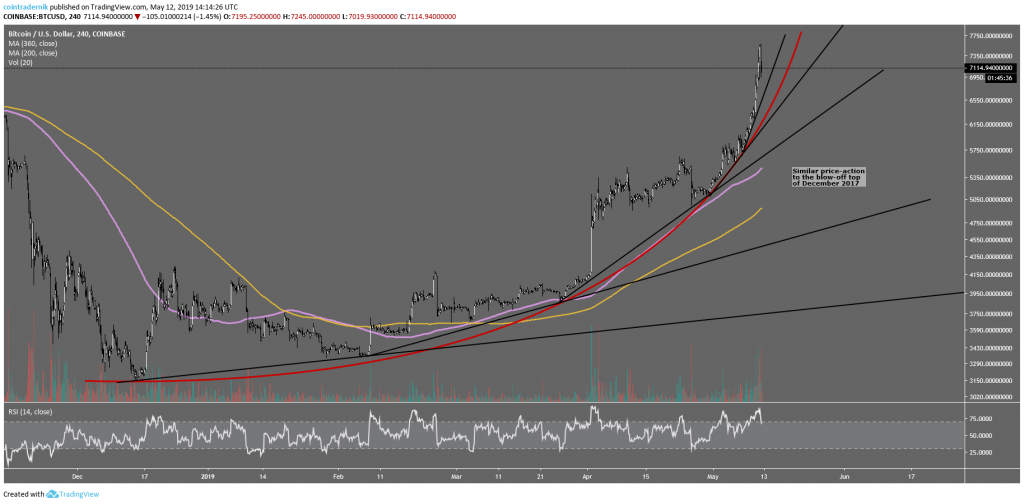
Looking now at the first Daily chart provided, I have depicted the parabolic curve of the bull run that culminated in the blow-off top at $20,000 in December 2017. Now, take a look at the 4H chart below it and observe the similarities in the curve of the rally: each leg proceeds to get steeper, culminating in that blow-off top pattern. But why have we had such an extended rally, blowing out levels of perceived significant resistance?
Well, I believe a large part of the answer is related to the Shorts/Longs ratio for Bitcoin. At the beginning of the week, this ratio was at all-time highs, indicating the extreme bearishness of market participants and an excess of shorts. With each successive leg up, more and more of these shorts were liquidated, causing Bitcoin to be bought at market price, pushing prices further and beyond levels that would have expected to give resistance. This cascading effect ends only when the shorts/longs ratio returns to normal, and the steep decline in the ratio over the past couple of days is indicative of this.
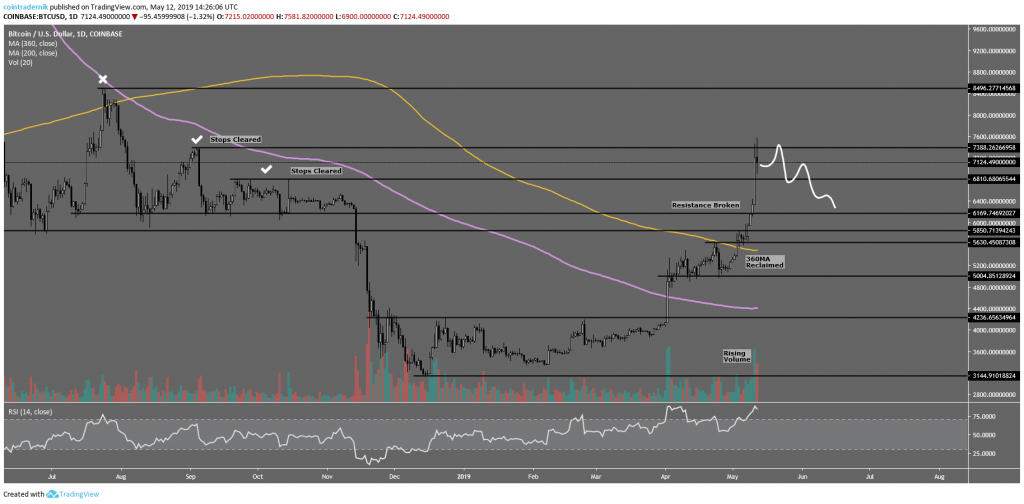
And what about current price-action? Well, let us look at the second Daily chart provided:
Here, we can see the multiple swing-highs cleared by the rally, as well as the direction I expect price to take from here. A retest of $7400 is possible but not required, but I do believe we’ll begin to break down towards the $6k area to retest it as reclaimed support.
Finally, the 1H chart shows that the parabola is indeed broken and thus it is likely that ~$7550 was the local top. From here we can expect price to to move towards key short-term support at $6930, which, if it gives way, will open up a move back down to $6800. A breakdown at $6800 would send price back towards the $6300 area.
Let’s see what next week brings us.
Ethereum:
ETH/USD
Weekly:
Daily:
ETH/BTC
Daily (1):
Daily (2):
15m:
Price: $188.10 (0.0265 BTC)
Market Cap: $20.041bn (2,810,020 BTC)
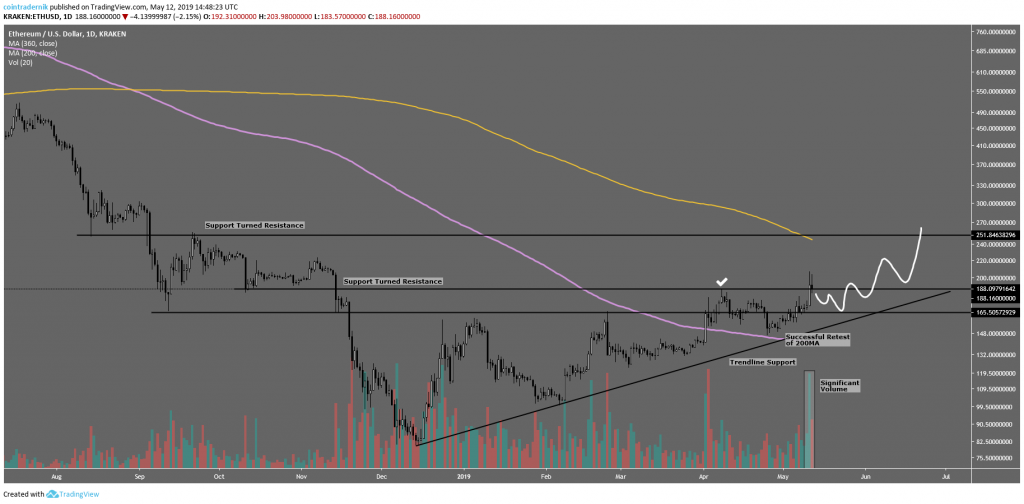
Thoughts: Now, looking at the Weekly chart for ETH/USD, I noticed that the uptrend that formed when Ethereum bottomed in late 2016 was never broken as price made its way towards the resistance at $15. Given that the cyclical bottom for ETH/USD is likely in now, we may see something similar hefollow, wherein the trendline support remains firm all the way to resistance at $350, above which I expect the real party to begin.
Looking at the Daily chart for ETH/USD, I have depicted this trajectory, anticipating a brief dip as BTC/USD dips but expecting this to be shortlived as ETH/BTC gets bought up. This past couple of days has experienc $ed huge volume on Kraken, as Ethereum has broken above the $188 resistance briefly, it is the $250 area that I am most interested in, as it is an area of support turned resistance but also in the region of the 360-day moving average.
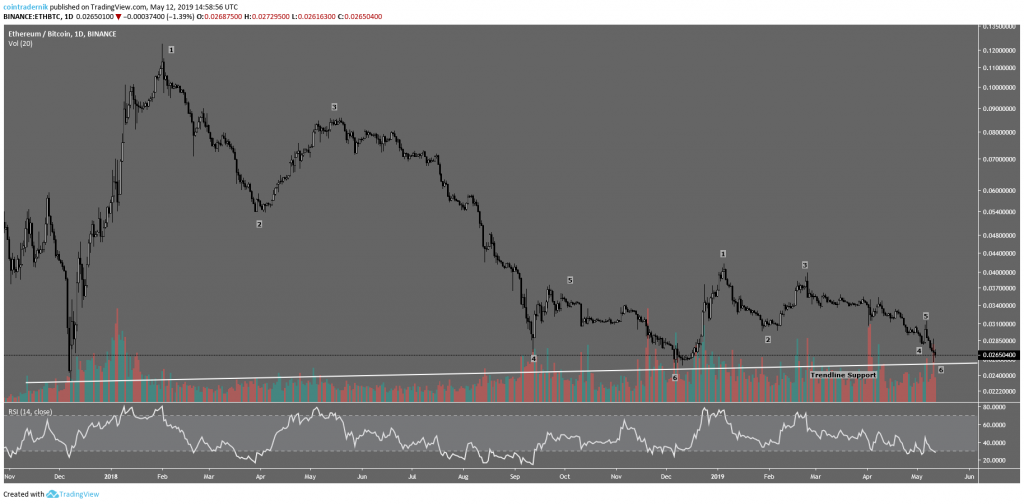
Turning towards ETH/BTC, which is where I believe capital will begin to flow (and subsequently to other alts) following Bitcoin’s local top, the first Daily chart shows the bounce from trendline resistance yesterday on significant volume. Further, it shows a similar fractal playing out to that of December 2017 – December 2018 but on a smaller scale. Such a fractal would have ETH/BTC bottoming out here and beginning a new rally to take out the highs at 0.042 BTC.
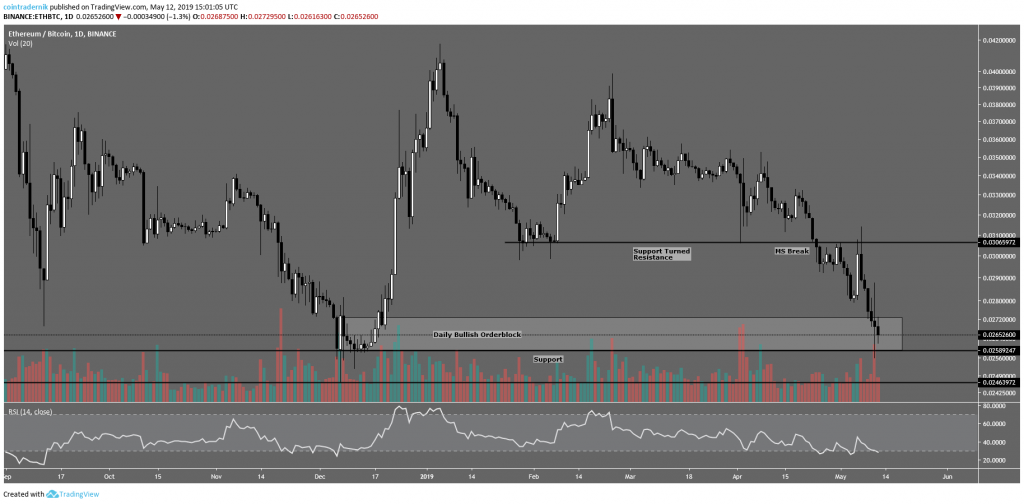
The second Daily chart shows the breakdown from support turned resistance at 0.0306 BTC. This is the level that needs to be reclaimed on the Daily timeframe for market structure to become bullish again. Also, it is interesting to note that the recent ETH/BTC price-action almost mirrors and inverts the parabolic curve of BTC/USD, culminating in yesterday’s local bottom at 0.0255 BTC.
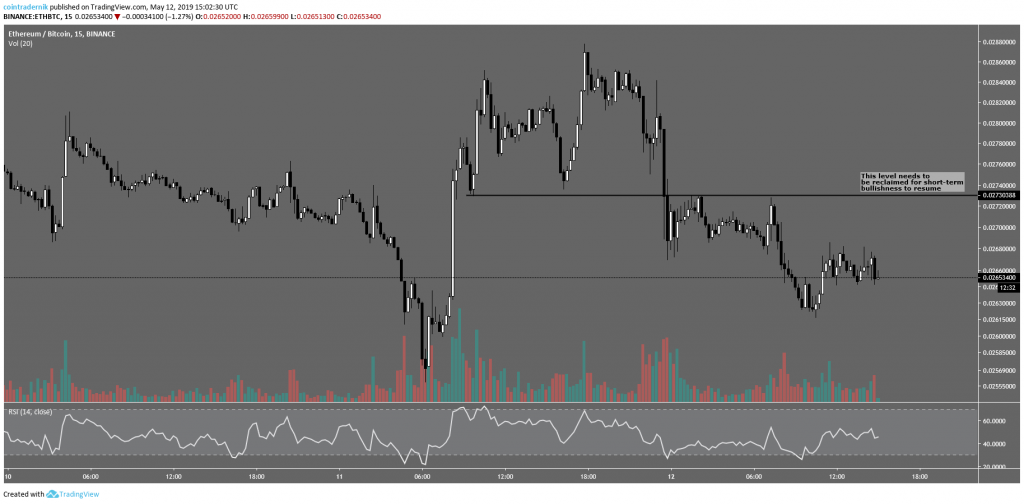
Finally, a much lower timeframe view – the 15-minute – shows us the level I would like to see reclaimed for ETH to make a move above 0.029 BTC.
Again, I expect that much of the capital that has bought into Bitcoin over the past week will flow into ETH/BTC as Bitcoin marks out its local top. Let’s see…
Monero:
XMR/USD
XMR/BTC
Price: $74.39 (0.01059 BTC)
Market Cap: $1.282bn (179,778 BTC)
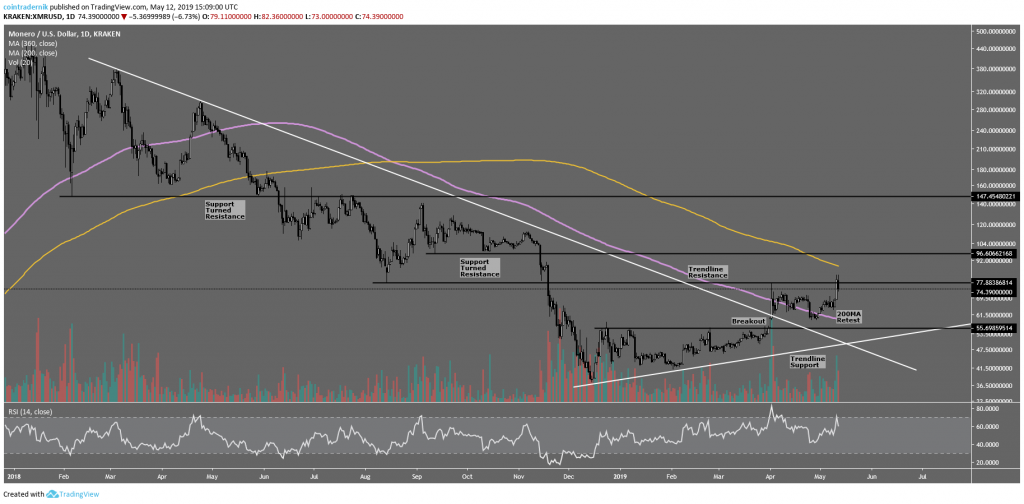
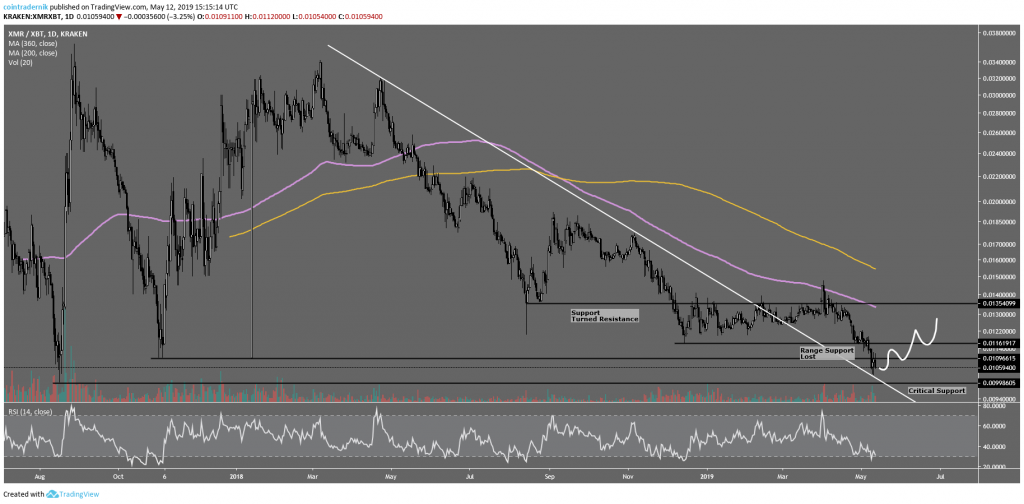
Thoughts: Monero looks similar to Ethereum here, albeit with a deeper spring on XMR/BTC than on ETH/BTC. On the XMR/USD chart, we can see the breakout above trendline resistance on signficant volume, as well as the successful retest of the 200-day moving average. There is significant resistance to overcome below $100, but, if Ethereum does lead the way, Monero will follow.
Looking finally at XMR/BTC, we can see that price is sitting right above critical support at 0.01 BTC, having fallen through range support at 0.0115 BTC last week. Below 0.01 BTC, there is little support for a long way down; as such, I suspect this is indeed a deep spring from which price will experience a sharp reversal over the coming weeks. A higher timeframe close below 0.01 BTC would spell doom, but a move back above 0.0115 BTC would cement the likelihood of a new bull cycle.
And that concludes this week’s Market Outlook.
I hope you’ve found some value in the read. If you have any questions or comments, feel free to leave them below.
If you’ve enjoyed this post and want to receive new posts straight to your inbox, I’ve set up a RSS-to-Email feed that will be sent out weekly; every Monday, 12pm. Just submit your email and I’ll make sure you’re included in the list. Cheers.


