
Market Outlook #206 (6th February 2023)
Hello, and welcome to the 206th instalment of my Market Outlook.
In this week’s post, I will be covering Bitcoin, Ethereum, XRP, Chainlink, Acala Token, Automata and RMRK. We’ll also be looking at Altcoin Market Cap against USD and BTC.
As ever, if you have any requests for next week’s Outlook, do let me know.
Bitcoin:
Monthly:

Weekly:

Daily:

Price: $22,875
Market Cap: $441.112bn
Thoughts: If we begin by looking at the monthly timeframe for BTC/USD, we can see that January closed extremely promisingly – we saw the previous fourth months of price-action engulfed in one candle and volume grew on the previous month. Price did close out right near trendline resistance from the all-time high but also closed at monthly highs, indicating that the top for this move is unlikely to be in. Given the strength of this close, bulls want to see the prior cycle highs at $19.8k defended hard on any retest and for the pair to then begin to push up into $25.4k as the next resistance. The next major resistance on the monthly timeframe, however, is the $28.8k-$30k breakdown zone, as untested prior support.
Turning to the weekly, we can see that the pair sold off last week just shy of 200wMA resistance, with the weekly high coming in at $24.3k. Volume was particularly low last week, continuing on from a pattern of declining volume over the past few weeks, but weekly structure is now firmly bullish with this higher-high above $22.4k. We would now expect to see any retracement form a higher-low, from which we should see $25.4k tested as major resistance. Close the weekly above that and I think we teleport to $29k pretty quickly, and any sign that we are reclaiming the 200wMA as support having now spent half a year consolidating below it would be majorly bullish in my opinion. That would be my sign that the worst is very much behind and a new cycle is underway, regardless of how long it then takes to actually begin a strong trend higher.
Dropping into the daily, we can see that there is some bearish divergence here on momentum indicators, with price wicking higher towards that $25.4k resistance but volume also dropping off. If this divergence plays out, which would be healthy to see for the overall trend, I’d expect to see the move from $20.4k retraced and the 200dMA right around prior cycle highs retested as support. If that is confirmed as support and a higher-low forms above it after taking out all of these little untapped lows, buckle up because I would expect another leg higher to begin much like the one that took us off the base. The bearish scenario here would be for price to now close back below prior cycle highs and begin retesting it as reclaimed resistance, making the move above it look like a deviation, but until that happens I am inclined to believe that we still have some juice here.
Ethereum:
ETH/USD
Weekly:

Daily:

ETH/BTC
Weekly:

Daily:

Price: $1,632 (0.07137 BTC)
Market Cap: $199.792bn
Thoughts: If we begin by looking at ETH/USD, we can see from the weekly that price rejected last week around prior support turned resistance at $1730 – a major historical level – just shy of the trendline resistance from the all-time high. This is a logical place for the pair to take a breather, and one would image ETH will simply follow BTC from here if the latter moves lower. Looking at the daily, we have some clean untested lows around $1510 and a similar pattern of momentum divergence to BTC/USD, indicating that if the pair does turn lower it is likely to sweep all of those before forming a higher-low. I have marked out prior cycle highs at $1430 as a nice area to look for the formation of a higher low, particularly with the 200dMA also sat right around there. If we fail to move lower and this divergence does not play out, there is significant resistance to overcome within the next 10% move higher, with not only that $1730 prior support, but also trendline resistance and the 360dMA at $1814. Clear all of this and reclaim it as support and I think we’ve got the beginnings of the next cycle underway, to be honest. Naturally, if we were to take all that resistance out and then reject and break down, you know the score – deviation from key resistance and likely most of the rally gets retraced. But it is looking very promising…
Turning to ETH/BTC, we can see that price is still chopping around the ~10% range that it has been for several months now, still holding above the mid-range as support at 0.0685 but capped by 0.078. Whilst we remain within this range, there really isn’t much to discuss. What bulls want to see is for ETH/BTC to rally if BTC/USD does retrace and start pushing beyond 0.078. If we see the mid-range fall with BTC/USD moving lower, that is a sign of inherent weakness in ETH. Let’s see how this week goes…
XRP:
XRP/USD
Weekly:

Daily:

XRP/BTC
Weekly:

Daily:

Price: $0.398 (1739 satoshis)
Market Cap: $20.24bn
Thoughts: Beginning with XRP/USD, we can see that resistance turned support at $0.33 continues to hold, with the pair sweeping the lows around support and pushing higher, now rallying right into trendline resistance from the 2021 high (which has continued to mark out local tops), as well as the 360dMA at $0.41 as reclaimed resistance. This is a turning point for the pair: either we see price get slapped down as it has done for two years and we just retest the $0.33 support again, or we finally see a breakout and reclaim of $0.42 as support. If we see the latter, I want to jump in and catch the 20% move into $0.51, where I would look to hedge any long exposure and then reopen once $0.58 gets cleared, as we then have bullish market structure and a 200wMA reclaim. Dropping into the daily, we can see just how tightly wound price has been in this range over the past week or two, with the 200dMA at $0.39 acting as support and $0.42 capping the pair. Start to close back below $0.38 and I think this just looks like another lower high in this long-term downtrend and we probably just bleed back into support. Keeping alarms set for the bullish scenario, however…
Turning to XRP/BTC, we can see that the pair has been trending lower since rejecting at the 200wMA just shy of 3100 satoshis and price has now returned back towards reclaimed support at 1615. This support has held price for the majority of the past two years, with a deviation below it that was followed by a reclaim. Weekly structure is currently bearish following the breakdown back below 1900 satoshis, but if we start to see signs of demand stepping back in around 1615, that might provide the confluence for a Dollar pair breakout and subsequent rally. If we drop into the daily, we can see that we have now lost the 200dMA and 360dMA, acting as resistance, and local trendline resistance has also been capping the bounces. I would be happy to step in as a buyer around 1615 if we see some momentum divergence into that support and then add if we break back above 1900 satoshis.
Chainlink:
LINK/USD
Weekly:

Daily:

LINK/BTC
Weekly:

Daily:

Price: $7.01 (30,590 satoshis)
Market Cap: $3.554bn
Thoughts: If we begin with LINK/USD on the weekly timeframe, we can see that the pair has been range-bound above $4.85 as support and below $9.75 as resistance for 273 days, with price currently hovering around the mid-range at $7.25. We are still sat below trendline resistance from the all-time high and weekly structure is still bearish here. Until we see price start to pop above trendline resistance and then the mid-range start acting as support, I am not super interested in LINK for any leveraged longs here (and it’s not one I’d look to play spot for a cycle). Turning to the daily, we can see that price is wrestling with the 200dMA, having faked out above it a couple of times recently. I am looking more closely at the 360dMA, however, as that has also capped price for a year and is lined up with trendline resistance; clear both and we have a good signal for a reversal. Until then, I’m steering clear.
Turning now to LINK/BTC, we can see that price faked a breakout above trendline resistance from the August 2020 all-time high a couple of months ago but has broken back below it and prior support at 34.6k satoshis, now bleeding into 29k. This does not suggest any sort of strength to me, but if we were to catch a bid above the May lows and form that longer-term higher low above it, and then break and close back above 34.6k, I think it begins to look more promising and I’d be checking for possible setups on the Dollar pair to play it long. All in all, there’s not a huge amount here for me though.
Acala Token:
ACA/USD
Weekly:

Daily:

ACA/BTC
Weekly:

Daily:

Price: $0.131 (573 satoshis)
Market Cap: $80.351mn
Thoughts: Right, Acala Token has only been trading since January 2022, and so I am going to focus on the Dollar pair here.
As we can see from ACA/USD on the daily timeframe, price has been in a perpetual downtrend since it began trading, forming an all-time high right at its inception and proceeding to lose 97% of its value into an all-time low at $0.094 in late November. Since then, price has been holding above the lows, though capped by prior support turned resistance at $0.16, and has formed a higher-low around $0.11 at present. We are currently sitting in no man’s land between those two levels, but given that ACA has never had a bull cycle and has now drawn down 97%, I am looking to scale in if we bleed lower back into $0.11. I will be looking to buy incrementally over the coming weeks whilst this range below $0.16 holds, and then add to my position if we can clear the 200dMA for the first time in its history and begin ticking higher. My invalidation on this is pretty clear – weekly close below $0.09. I’d then look to rebuy on a reclaim or formation of a range even lower…
Automata:
ATA/USD
Weekly:

Daily:

ATA/BTC
Weekly:

Daily:
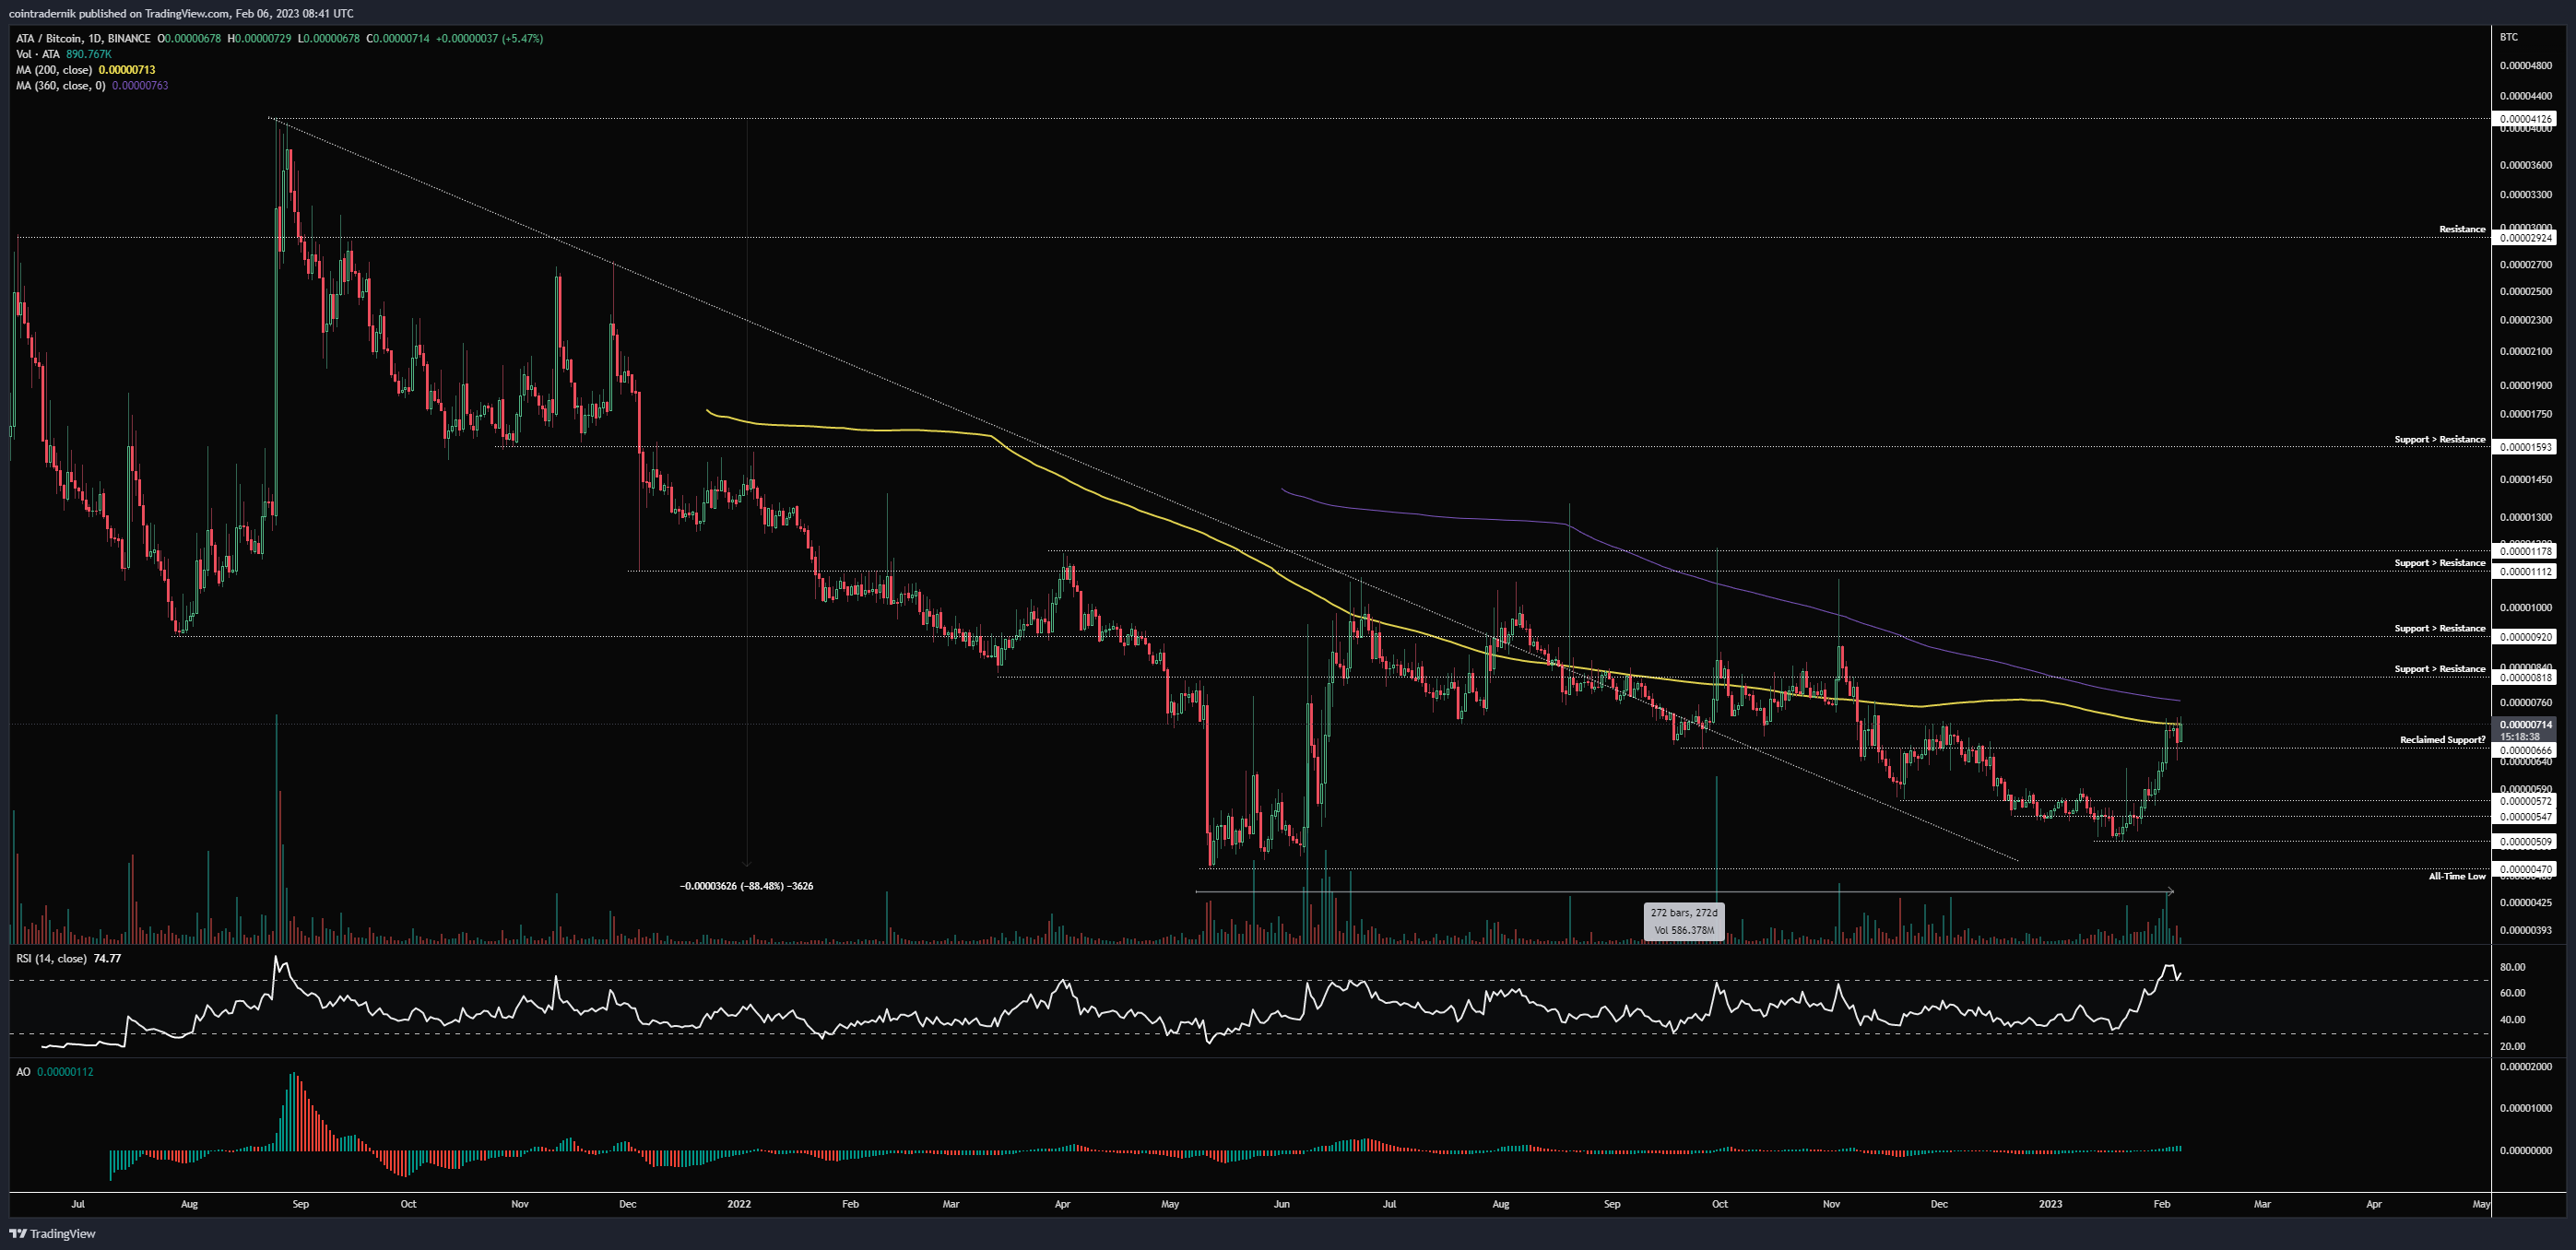
Price: $0.164 (718 satoshis)
Market Cap: $54.697mn
Thoughts: Again, much like ACA, Automata has only been trading since July 2021 and so the pairs look virtually identical here, so I will focus on the Dollar pair.
Looking at ATA/USD, we can see that price rallied off early support in July at $0.35 into the all-time high at $2.05, and has since drawn down 95% into an all-time low at $0.09 in mid-November, retesting that low in early January and then rallying for several weeks since, reclaiming prior support at $0.12 which had previously been the May 2022 low. This is an important reclaim following a double bottom at all-time lows, and if we can retrace part of this rally back towards $0.12 to retest that support base, I would be keen to get involved. My invalidation is super clear and tight here, as any move back towards the all-time low at $0.09 invalidates the entire thesis of the double bottom being a deviation of the May lows. I am looking to hold this for a cycle, much like ACA, as we have no real prior bull cycle, with first sells likely to come in around $0.35, followed by $0.75 and then fresh all-time highs. These are precisely the sorts of setups I will be looking for this first half of 2023.
RMRK:
RMRK/USD
Daily:

RMRK/BTC
Daily:

Price: $2.44 (10,650 satoshis)
Market Cap: $23.138mn
Thoughts: Before I take a look at RMRK, I’d like to mention that this is a subscriber request and I have not really studied its fundamentals at all, so I am purely focusing on price-action here.
Much like the prior two tokens, RMRK has only been trading since October 2021 and therefore I will look solely at RMRK/USD, as it has very clean structure.
Price rallied from inception off support at $4.40 into an all-time high at $66 and then lost 97% of its value from that December 2021 high into an all-time low at $1.68 in mid-December 2022. Since, price has broken above trendline resistance from the all-time high, reclaimed multiple levels of support and briefly broken above the 200dMA for the first time in the pair’s history. We are now retracing a little back below the 200dMA but given the extent of the rally and the small market cap this is unsurprising. From a purely cyclical perspective, this very much looks like the beginnings of a reversal, and if we can see the $2 support hold from here on any retracement, I think that looks like good value with clean invalidation for a longer-term play, with a huge gap above $4.44 into the next major resistance around $7.50…
Altcoin Market Cap:
ALT/USD
Weekly:

ALT/BTC
Weekly:

Market Cap: $573.105bn (25.06mn BTC)
Thoughts: Finally, let’s take a look at Altcoin Market Cap.
If we begin with ALT/USD, we can see that the market has been range-bound above $422bn for ~200 days now, with the market unwilling to break below that on multiple attempts since May last year. The 200wMA was acting as resistance for a short period in late 2022, but since the most recent test of $422bn, the market has rallied back above it and prior cycle highs, turned weekly market structure bullish and is now sat just below prior support turned resistance at $612bn and trendline resistance from the all-time high. $612bn is a really key area here, and even if we dip lower initially, as long as alts can hold back above that $480bn prior cycle high, I think we break higher and reclaim $612bn as a support base like in April 2021. From there, we’d want to see a clean break and close through trendline resistance and for that zone to then form another higher-low from which alts can push another 25-30% higher to fill the gap into $850bn.
Turning to ALT/BTC, the most strange thing about this cycle relative to previous cycles is how relatively well altcoins have held up against BTC. In fact, alts have basically been range-bound against BTC on the whole since April 2021, with 19.3m acting as market support and 28.4m acting as market resistance. That support base is quite interesting too as the basic takeaway is that altcoins are effectively unwilling to be less valuable as a collective than Bitcoin’s fully dilution valuation – that ~20mn BTC area just keeps providing support and alts regain market share every time it is tested. More recently, we have seen BTC regain 15% market share from the 28.4m area down into support at 24mn, but if alts can form a higher-low here I would expect another bounce back towards range highs. The real shift in fortunes for alts will come if and when that 30mn all-time high gets broken – 28.4m has capped the altcoin market share since April 2021 but I would fully expect the next cycle to see another period of outperformance that takes altcoin market cap to new highs relative to BTC.
And that concludes this week’s Market Outlook.
I hope you’ve found value in the read and thank you for supporting my work!
As ever, feel free to leave any comments or questions below, or email me directly at nik@altcointradershandbook.com.