Market Outlook #172 (25th April 2022)
Hello, and welcome to the 172nd instalment of my Market Outlook.
In this week’s post, I will be covering Bitcoin, Ethereum, XRP, Solana, Cardano, Fantom, Oasis Network, Synthetix and Celer Network.
As ever, if you have any requests for next Monday’s Outlook, do let me know.
Also, this month’s subscriber-exclusive Coin Report will be out later this week. It will be featuring Gather, as that project won the community poll.
Bitcoin:
Weekly:

Daily:

Price: $38,502
Market Cap: $732.115bn
Thoughts: If we begin by looking at BTC/USD, we can see from the weekly that price once again rejected from resistance at $42k, taking out the prior weekly high, deviating above that resistance level and then selling off back towards the weekly low, closing around $39,500 on higher volume than the previous week. This is not ideal for bulls given the loss of key reclaimed levels, but we are now approaching that cluster of support that preceded the rally into the yearly open, as expected. I would now expect to see another week of selling back into that $37.4k level, where the reaction will be critical. If we can sweep below $36,300 this week and then close the week back above $37.4k, I’d be more willing to consider that a higher-low has been put in and that we are at the very least due a retest of $42k. If, however, we close below $36k this week, I think we have a lot more blood to follow with price likely to resume this longer-term downtrend back towards the 2021 open around $29k.
Dropping into the daily, we can see the structure more clearly, with a sweep of the prior weekly low into $38,900 leading to the rally into the $42k region, which took out the prior weekly high, with price then rejecting up there and resuming the move lower. When we see this sort of whipsaw action, the second rejection tends to be the key one – in this case the rejection above the prior weekly high – and that has manifested in lower prices over the weekend and into this morning, with price now retesting last week’s low. If we start to close the daily below that level, that opens up that next move lower into the trendline and support cluster that I have been positioned for, as per last week’s outlook. The only way I would expect to resume a bullish bias is once we see price accept back above $42k, so even if I get fills this week around $37k if we get that sweep and reclaim, I would only be looking for $41.5-42k to offload into.
Ethereum:
ETH/USD
Weekly:

Daily:

ETH/BTC
Weekly:

Daily:

Price: $2,811.95 (0.07299 BTC)
Market Cap: $339.049bn
Thoughts: Looking firstly at ETH/USD, we can see on the weekly that price followed BTC but structure remains more clear here, at least for the moment. We are again battling with the mid-range having lose the $3000 support level, and so the bullish picture following the breakout rally is beginning to shift a little, but for now this looks like a pull-back into trendline support on declining volume as opposed to anything particularly weak, unlike BTC/USD. If this week sees price close below the mid-range and the trendline support, I think it starts to looks weaker, and though price can conceivably drop as low as the $2425 area without breaking weekly bullish structure, I don’t think it shows any strength at all following a return to that bullish structure if the rally that broke bearish structure is immediately and fully retraced. What you would want to see is a higher-low begin to form above the $2660 area, where one could then scout for longs back towards the yearly open. Dropping into the daily, we can see that daily structure has been bearish for a while now with prior supports acting as resistance on each leg lower, and thus we would expect any rally back into $3000 early this week to be faded as price moves lower to potentially form that higher-low. What I would want to see to get long is price to wick into and below the trendline and then demand step in and take price back above the mid-range, following which I would want to buy a retest of the trendline as support if we get it. I could also take a short at $3k or so if it is presented over the next couple of days, looking for that $2660 retest with invalidation at last week’s high / the 360dMA.
Turning to ETH/BTC, again the picture has not drastically altered, with all of the previous three weekly ranges – despite each breaking a little lower than the previous – being traded within the range of the most recent green week. This week has the opportunity to close below that 0.073 support and that would indeed start to look more bearish, at least short term, with price then likely to return to the mid-range at 0.0689 to find support, which again looks quite weak given that it would have retraced the entire impulse rally from a few weeks ago. Really, bulls want to hold this area between 0.069 and 0.073 and defend it hard, with any higher-low that begins to form in this area opening up the likelihood of another leg higher towards the top of the range at 0.0823.
XRP:
XRP/USD
Weekly:
Daily:

XRP/BTC
Weekly:

Daily:

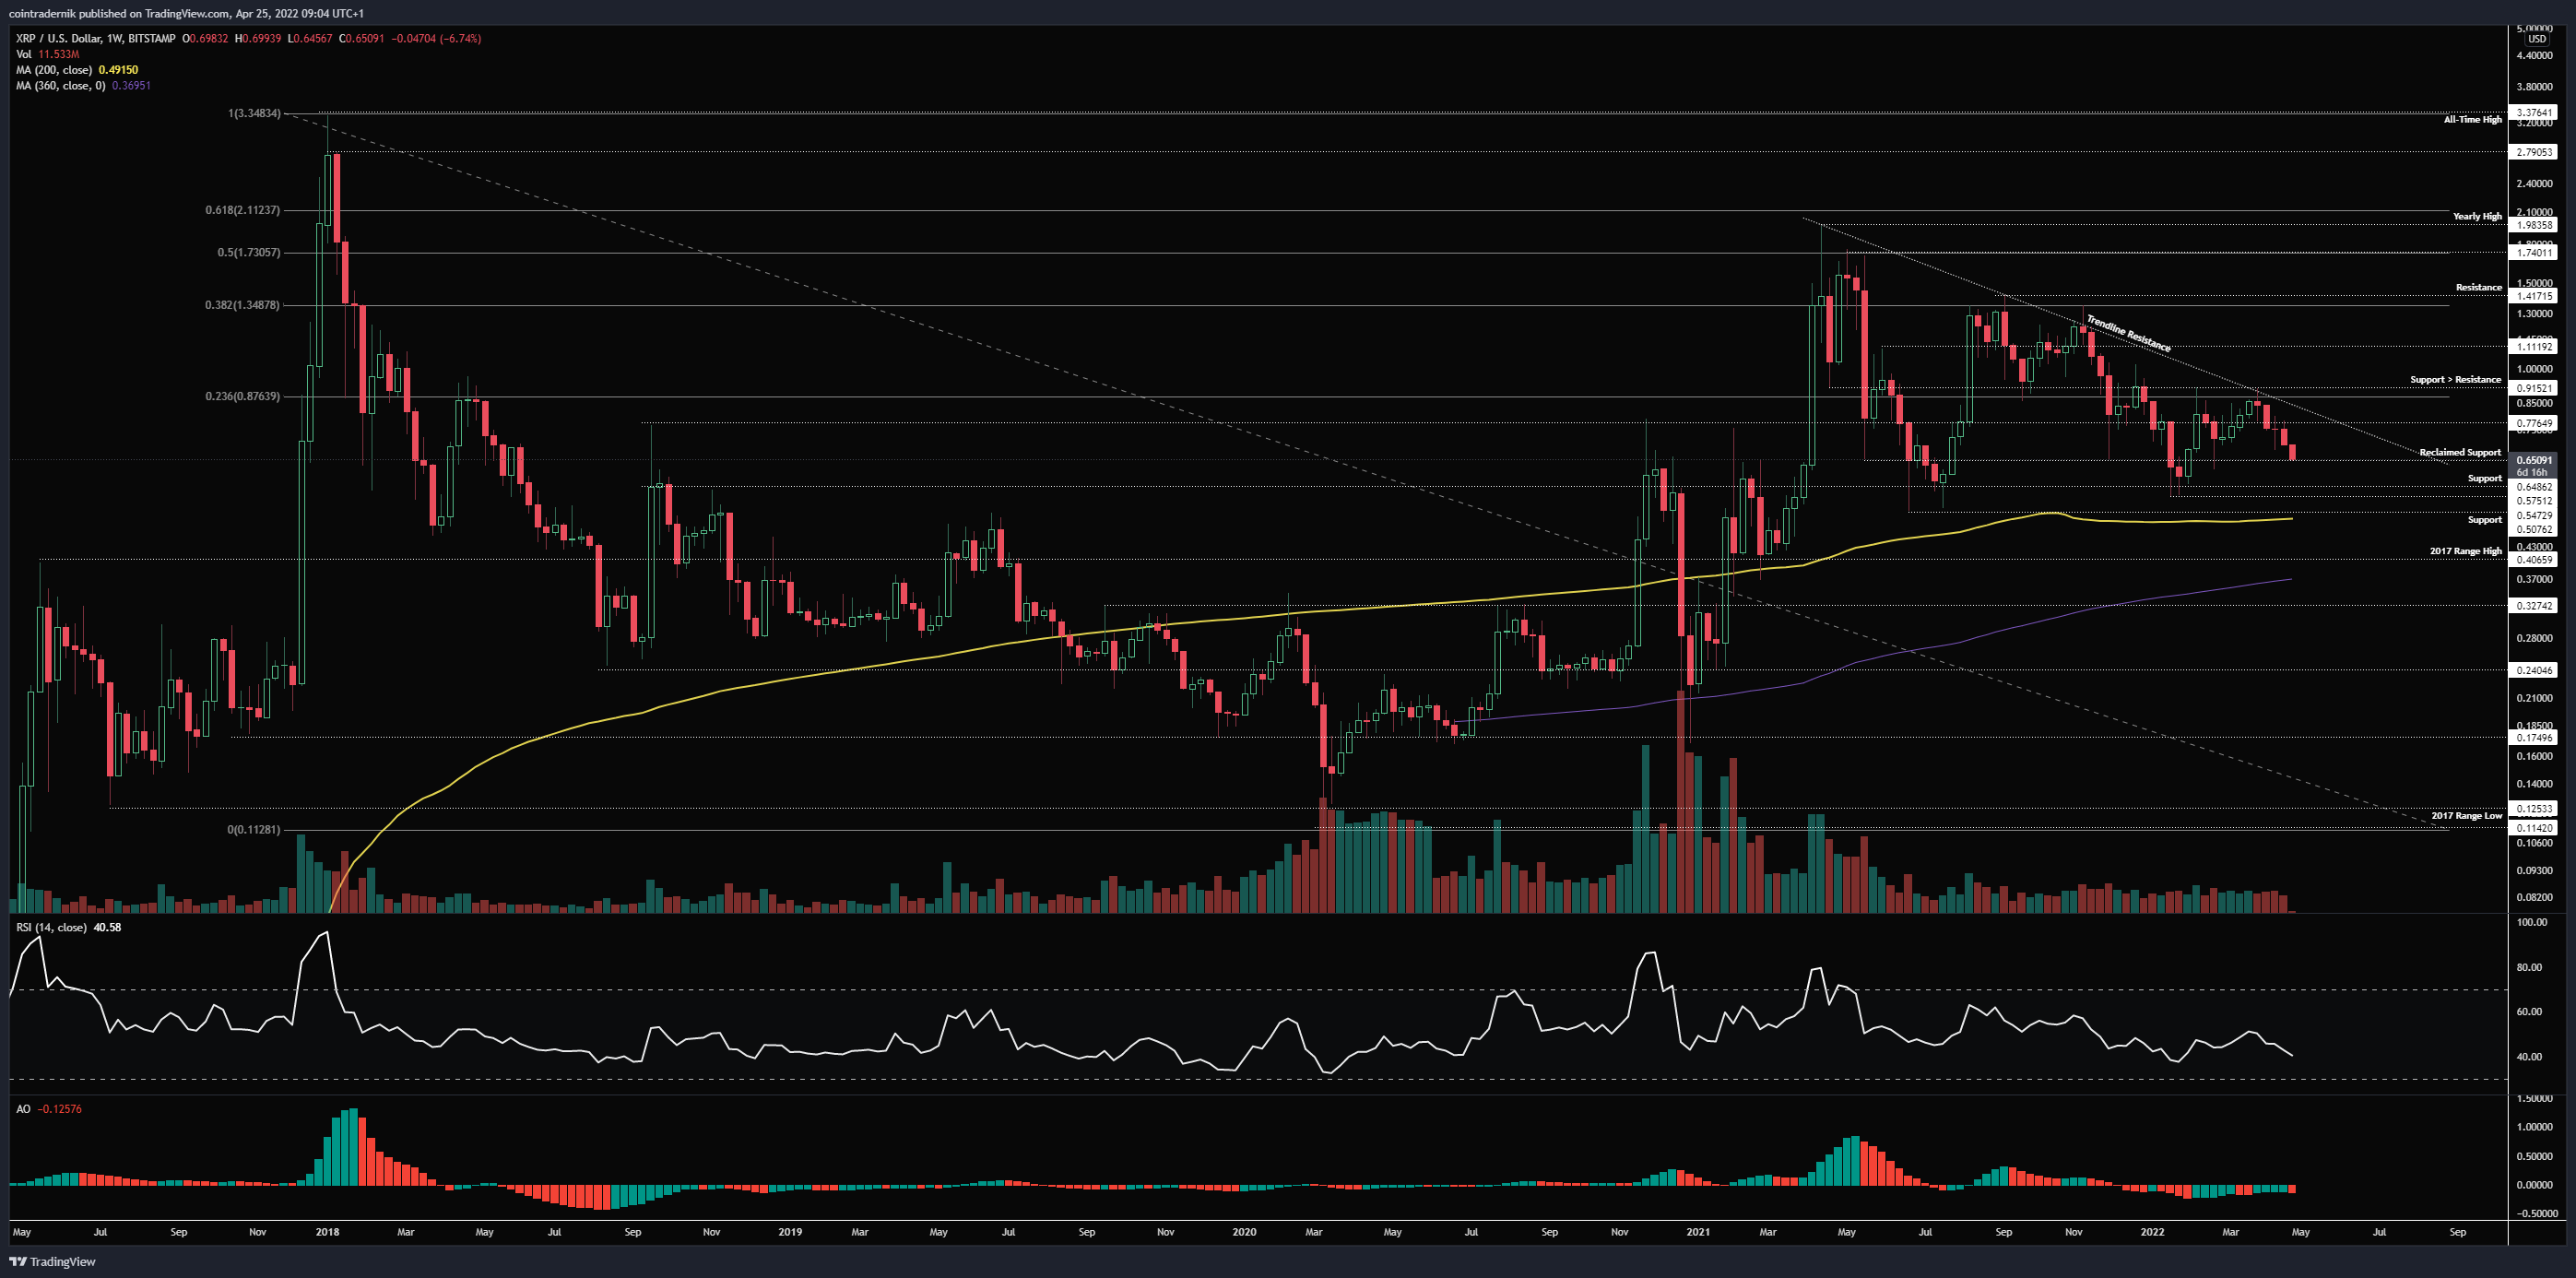
Price: $0.65 (1695 satoshis)
Market Cap: $31.397bn
Thoughts: If we look firstly at XRP/USD, we can see that price rejected precisely where the highest R short opportunity was, as outlined a few weeks ago, with the trendline continuing to cap price and the pair turning lower back towards reclaimed support at $0.65. I am still in this short but have moved my stop lower into $0.79 and am looking for $0.58 to cover fully. Once we get into that support zone, that is where shorts are no longer favourable, but given that we continue to see weaker bounces off the 200wMA, I am not keen to get long there either to be honest. In fact, this sort of looks like a descending triangle into that 200wMA, which would indicate seriously lower prices if the 200wMA gives way around $0.50. If over the course of the next few weeks that level is closed below on the weekly timeframe, I would expect to see price return to the $0.33 area. If, however, the 200wMA holds and the descending triangle does not play out, I would only look for longs once that trendline resistance is broken and closed above, then looking to buy a reclaimed support level for the next leg higher.
If we turn to XRP/BTC, despite the pair consolidating for months in a very tight range below 2100 satoshis and above 1700, we are now starting to break below that support level towards the major support at 1485, which, as I have mentioned multiple times, is the most critical support on this chart as it has been holding the pair up for a year now. If we break and close below that, there is a long drop into the next support at 940. If we do trade lower into 1485, I would look to buy some spot there for a minor bounce back towards 1700, with invalidation on a close below 1485 and a tight stop around 1350. Other than that, long-term bullishness only comes into play for me down at 940 or on a weekly close above 2100, which, if we briefly turn to the daily, is also where the 360dMA is capping price.
Solana:
SOL/USD
Weekly:

Daily:

SOL/BTC
Weekly:

Daily:

Price: $95.30 (0.002475 BTC)
Market Cap: $31.789bn
Thoughts: Looking at SOL/USD on the weekly timeframe, we can see that price rejected just below prior support at $144 and has moved lower, returning towards minor support at $91. Now, it is important for SOL bulls to defend this zone between $83 and $91, as I think if we lose the lower level, the $75 support is going to get blown out and price will begin another leg lower towards the $54 area. Weekly structure is bullish following that rally into $144 and so it is more likely that we do see some demand step in above $75, but given that we rejected from the 200dMA and have now retested the 360dMA from below as resistance and broken down, I am not particularly interested in trying to be a hero here. Retesting the $83 area would me a retracement of basically the entire rally and with the rest of the big boys looking to move lower, I don’t see why SOL would be an outlier here. If we see demand step in at $83, however, and then daily structure turns bullish again, then I could look for opportunities to get long for another test of that 200dMA at $144.
Looking now at SOL/BTC, we can see that price is now returning to the original range support, which bulls will want to see defended at 0.00239. If that level is close below following the deviation and breakout rally back above it, it would look to me more like a lower high in this downtrend and that we are on course for a test of 0.0018 and potentially as low as prior range resistance at 0.00137. Looking at the daily, I have provided two ways I am looking to play this given the structure here, with a long off the reclaimed range support and 360dMA, and a short on a breakdown below the 0.0022 (where I would exit that first long fill) and look for 0.00177. Clean.
Cardano:
ADA/USD
Weekly:

Daily:

ADA/BTC
Weekly:

Daily:

Price: $0.83 (2159 satoshis)
Market Cap: $28.092bn
Thoughts: Beginning with ADA/USD, from the weekly we can see that price has indeed put in another lower high below the trendline resistance and turned lower, once again breaking and closing below major support at $0.90. This was precisely what I would expect of a weak market and I would expect to now see the pair break below $0.75 and move towards that 200wMA and then finally into $0.42 where I expect more demand to step in. I have covered my ADA shorts this morning as we move towards that $0.75 area and will look for fresh short setups on a clean breakdown below that level. If we look at the daily chart, we can see how clean this downtrend has been and if we start to close that daily below $0.75 I see no real support left (except that 200wMA) for another 30-40% move lower. The only bullish scenario here would be for $0.75 to be defended hard and price to once again reclaim the $0.90 level, where I would then look for longs into trendline resistance, and only on acceptance above that trendline would I expect the trend to shift.
Turning to ADA/BTC, the pattern is very much the same as the Dollar pair, with rejection at reclaimed resistance at 2530 and price turning lower into resistance turned support at 1975. As has been the case for months now, I still believe this is trending towards that 200wMA and the 2020 highs at 1500-1600 satoshis, which is where there is a possibility for relief and even for the trend to have a longer-term reversal, if buyers step in as one would expect at such a significant level. Not much else to add on this one – textbook downtrend.
Fantom:
FTM/USD
Weekly:

Daily:

FTM/BTC
Weekly:

Daily:

Price: $1.00 (2597 satoshis)
Market Cap: $2.535bn
Thoughts: If we begin with FTM/USD, we can see that price has moved lower off another lower-high, now trading into range support at prior range resistance ~$1. This is a very important level for the long-term trajectory of Fantom, in my opinion, as any weekly close below and back inside the previous range would open up the possibility of moving much lower towards range support of that range down at $0.25-$0.30. If, however, we wick below $0.90 and then see demand step in and price break back above $1 and start to form a base, there is a case for a new accumulation range forming at this key historical level, where I would then be interested (in several weeks time) at looking to build a position. If we look at the daily, however, the likelihood of the bullish scenario seems lower than the bearish given how structure has shifted since the previous range, with the 200dMA and the 360dMA now acting as resistance as opposed to range support. If we do start to close below $0.91, there is also no real support below that back towards $0.57, which itself is quite a minor level. Very keen to keep a close eye on Fantom throughout May for a better indication as to where this is headed. Either way, I am keen to be a buyer but whether it is within a range around $1 or down at $0.30 I do not yet know.
Turning to FTM/BTC, price has lost the long-term uptrend and reclaimed several levels of resistance, now looking to test support at 2420 satoshis. Below this level, there is a 25-30% fall towards the next support cluster at prior range resistance ~1800 satoshis. If I’m looking longer-term, I would ideally as a buyer want to see price retrace all the way towards that historical pivot at 450-500 satoshis, where accumulation for the next cycle is extremely appealing, but failing such value, I think that the 1600-1900 range could provide some demand, and if that area is lost on the weekly timeframe, then the pair is really in trouble and I am likely to get my wish.
Oasis Network:
ROSE/USD
Weekly:

Daily:

ROSE/BTC
Weekly:

Daily:

Price: $0.20 (525 satoshis)
Market Cap: $708.247mn
Thoughts: Looking firstly at ROSE/USD, we can see from the weekly that price printed a lower high at $0.33 and has since moved lower, coming back into the support zone at $0.20 and looking to break below it, with minor support at $0.185 the only level really holding this up. If we do break below that latter level this week, I would expect to see another 25% move lower into support at $0.14, but ultimately this really does not look appealing to me until we start to form a range at a historical support level, much like in June 2021. I would like to see such a range form with prior range resistance at $0.08 acting as support over the coming months, but failing that I would be happy to pick this up at $0.14 if we see buyers step in and price begin to flatten out there. Looking at the daily, we are also testing the 200dMA here, which has never been closed below, so closing below that over the next couple of days would be an early indicator of the momentum to the downside. That range between $0.115 and $0.14 is then the likely candidate for a new demand zone but I will want to monitor the rich-list when we get down there to see if larger holders are buying. If we are to get that extreme bear market pricing, then $0.08 makes a lot more sense as it would be an ~85% drawdown from the high, which is the bare minimum that the vast majority of projects reach before finding a cyclical bottom.
Turning to ROSE/BTC, we can see that price is now breaking below support at 522 having rejected at reclaimed resistance at 720 satoshis, opening up that next leg lower towards a historically significant cluster of support between 377 and 418 satoshis, where again I would expect buyers to step in, particularly as there would a possibility there of forming a macro higher-low within this long-term uptrend following the correction from the all-time high. Failing that, again I am looking much much lower down at the 170-250 satoshis range that began this trend.
Synthetix:
SNX/USD
Weekly:

Daily:

SNX/BTC
Weekly:
Daily:

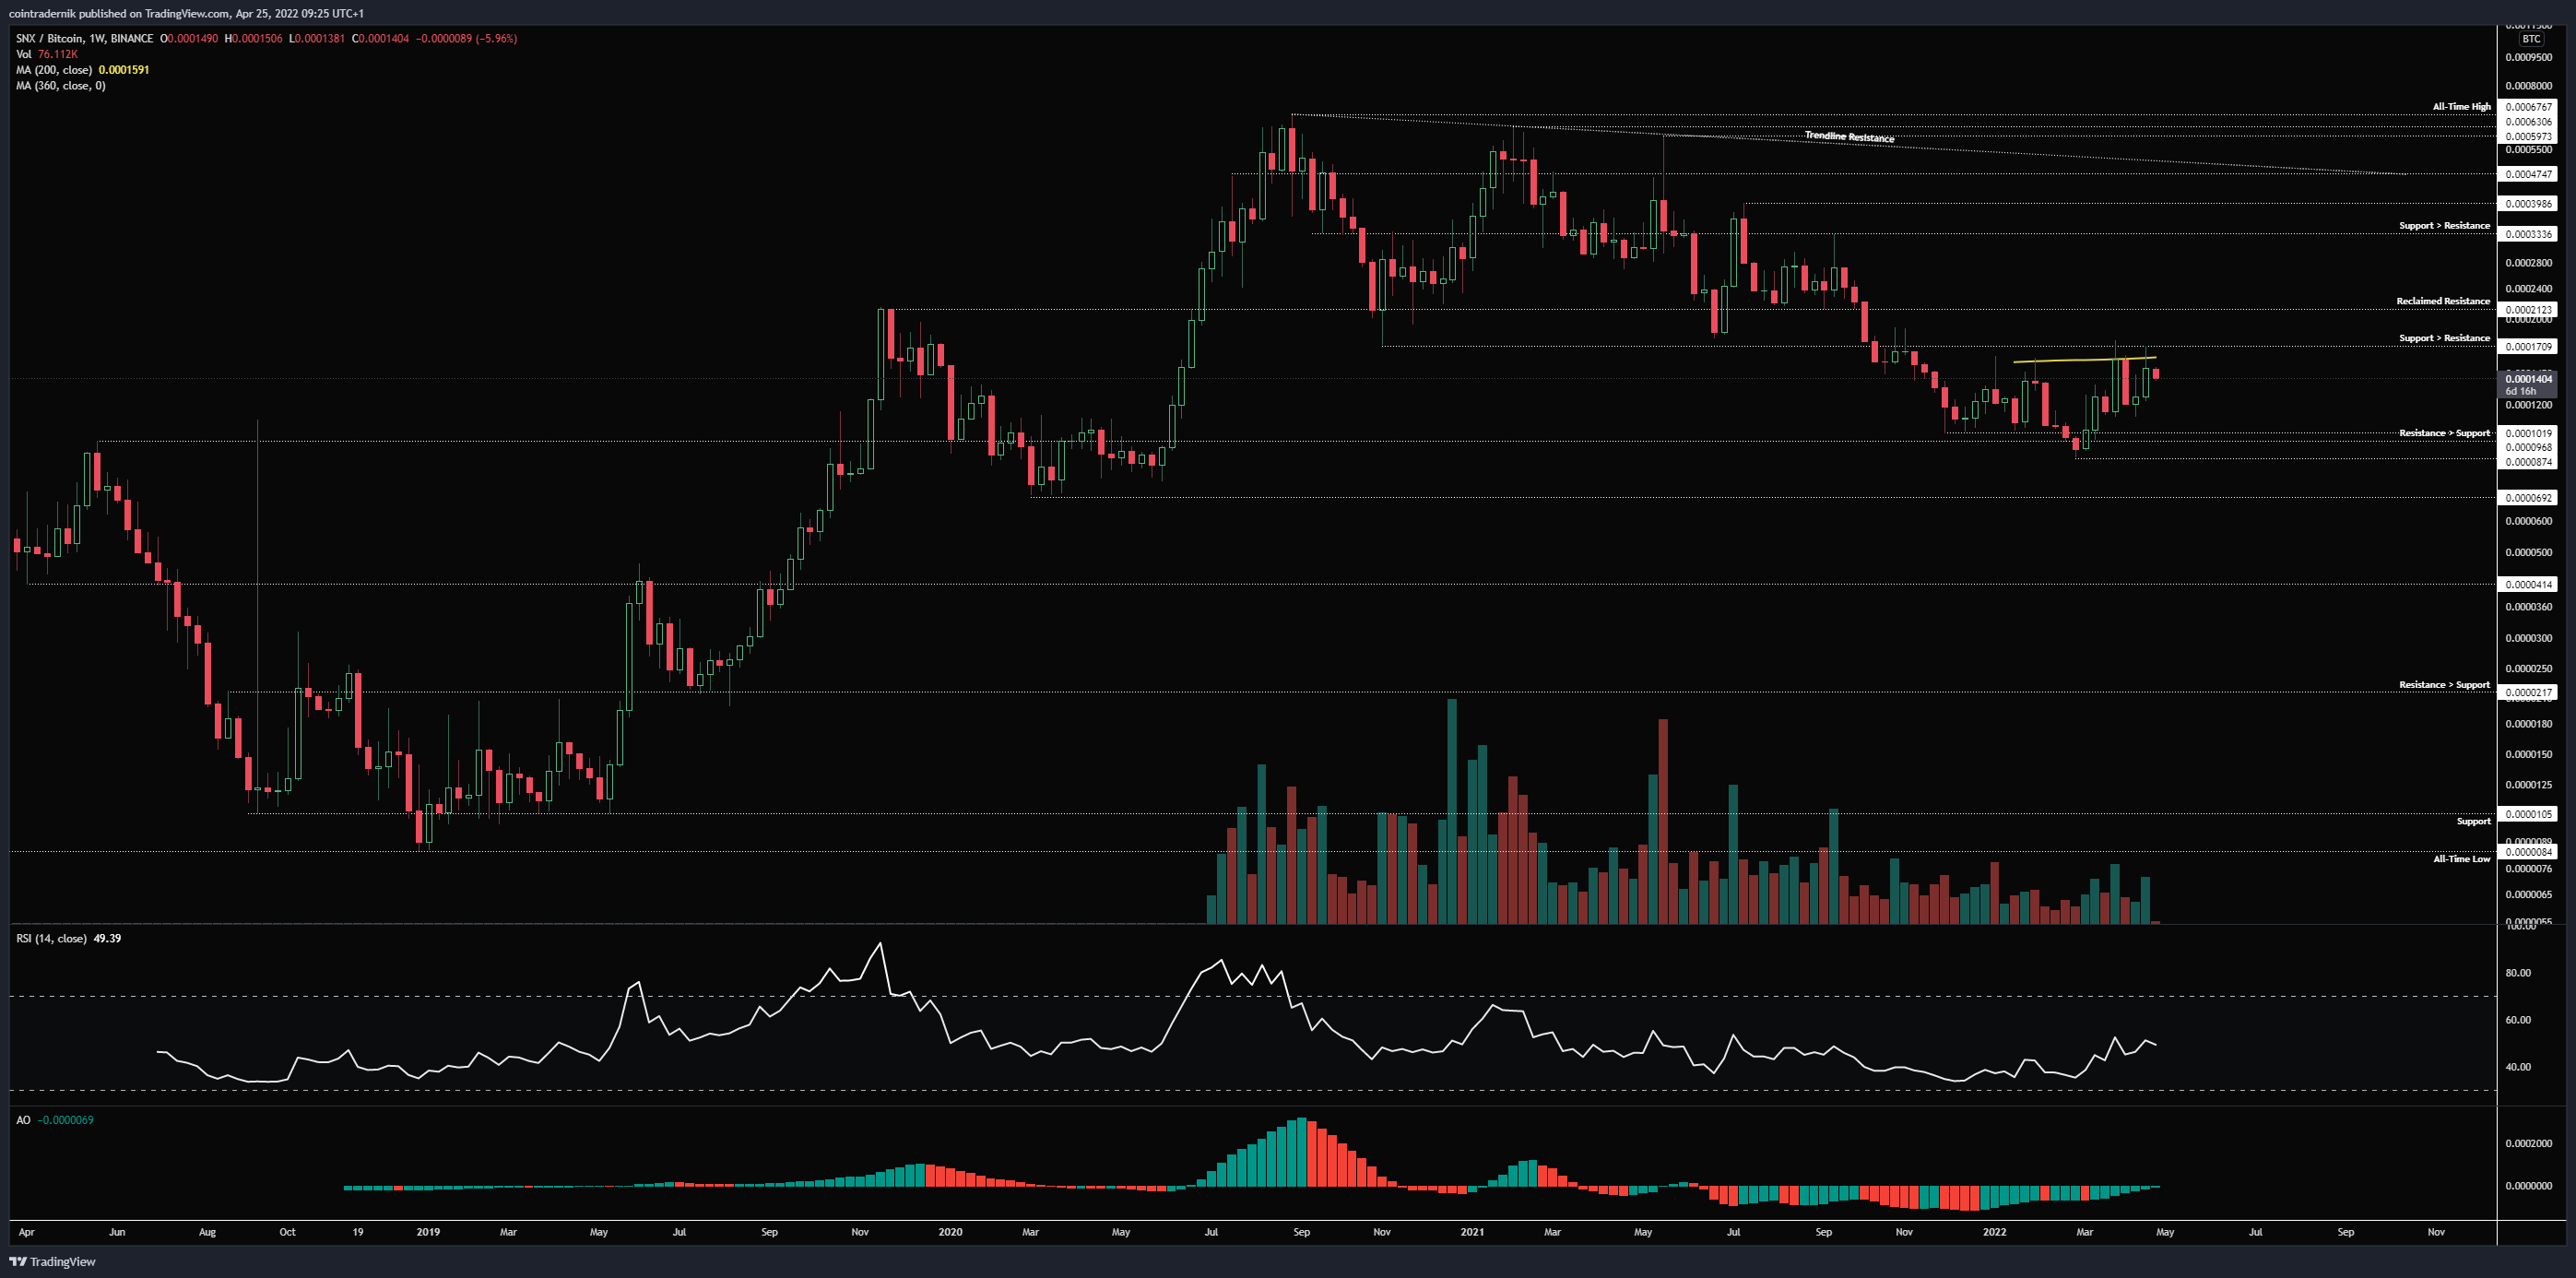
Price: $5.41 (14,040 satoshis)
Market Cap: $616.402mn
Thoughts: If we look at SNX/USD on the weekly, unlike many projects it appears to have already bottomed out in some respects following a 14-month bear market from the January 2021 all-time high at $30.27. Price fell all the way into $3.31, printing a sort of three drive pattern into that level before rallying off it and turning weekly structure bullish on the close above $6.11, then rejecting at reclaimed resistance ~$8.25. Since, price has move lower, retesting support around $4.68, putting in a lower high and now consolidating around $5.52. Ultimately, if this is a bottom, you know would not want to see a weekly close below $4.32 as that turns weekly structure bearish once again, but one thing to note is there is clearly some demand around that $3.30 area, so if we do lose $4.32, I want to be bidding that support zone below it. Alternatively, I would actually be keen to buy a break and close back above $6.12 from here, as if we look at the daily we can see that is where the 200dMA is capping price and that MA has been holding the pair down for nearly a year. Reclaim $6.11 here and I am in for at least a retest of $8.25, with any acceptance above that level really looking strong, with $13.42 the next major resistance above that.
Turning to SNX/BTC, we are consolidating above prior resistance turned support at 9700 satoshis, with resistance at the 200wMA and prior support ~17k satoshis. This is a nice range for re-accumulation to take place, providing confluence for the possibility of a cyclical bottom above $3.30 on the Dollar pair. Again, I would be keen to buy either down near 10k satoshis or on a weekly close above 17k. Really nice structure here with clear invalidations. If 8750 satoshis is lost, it is a long way down to the next major support at 4140, as I do not expect 7k to hold given how long price has been ranging just above it.
Celer Network:
CELR/USD
Weekly:

Daily:

CELR/BTC
Weekly:

Daily:

Price: $0.044 (115 satoshis)
Market Cap: $303.895mn
Thoughts: Beginning with CELR/USD, we can see on the weekly that price has put in a lower high like the rest of the market below resistance at $0.088 and move lower, now contesting the historical trendline support and looking to break below it, albeit with some support here at $0.04. If we do continue to move lower, this trend gets invalidated for me and I would expect any weekly close below $0.03 to lead to another push lower to take out the cluster of support at $0.021, with $0.014 the major level below that as prior resistance. To be honest, whilst CELR was looking decent as it approached that trendline the first time a few weeks ago, it is now looking more likely that this trend does not continue with another leg higher to me, and I would expect to see $0.03 traded through over the coming weeks. Looking at the daily, we can see that the 200dMA and 360dMA acted as resistance on that last push higher where they have been acting as support throughout the trend, so this shows us where the momentum is now and it is to the downside.
Turning to CELR/BTC, again we see a fake-out above trendline resistance, as we have seen on a couple of other projects, leading to a turn lower and price looking to make its way back to major support at 82 satoshis, which is a key historical level. IF that level does give way, I think 67 satoshis gets traded through hand we likely retrace the bulk of this bull run back towards the 2020 support levels at 32 satoshis, potentially as low at 19 satoshis. Obviously, this is a long-term perspective that depends on whether this major cluster of historical support between 67 and 82 satoshis gets broken through, as there is also the possibility of a deviation below 67 and reclaim above, with the pair then basing above that level again just like the summer of 2021. A lot of this is highly dependent on the state of the large-caps, in particularly Bitcoin and Ethereum, as if they begin to lose those critical levels ($29k and $1700, respectively) over the next couple of months, the wider market is likely to enter a period of undervaluation as opposed to overvaluation, much like mid-to-late 2018, with seriously depressed prices, which for us would offer buying opportunities. The alternative as I mention is for those key levels to hold on the large-caps and for the rest of the market to then find a base around the summer 2021 support levels.
And that concludes this week’s Market Outlook.
I hope you’ve found value in the read and thank you for supporting my work!
As ever, feel free to leave any comments or questions below, or email me directly at nik@altcointradershandbook.com.