Market Outlook #141 (23rd August 2021)
Hello, and welcome to the 141st instalment of my Market Outlook.
In this week’s post, I will be covering Bitcoin, Ethereum, Tron, Cosmos, Algorand, Synthetix, Harmony, Reserve Rights and COTI.
As ever, if you have any requests, please do drop me an email or leave a comment.
Bitcoin:
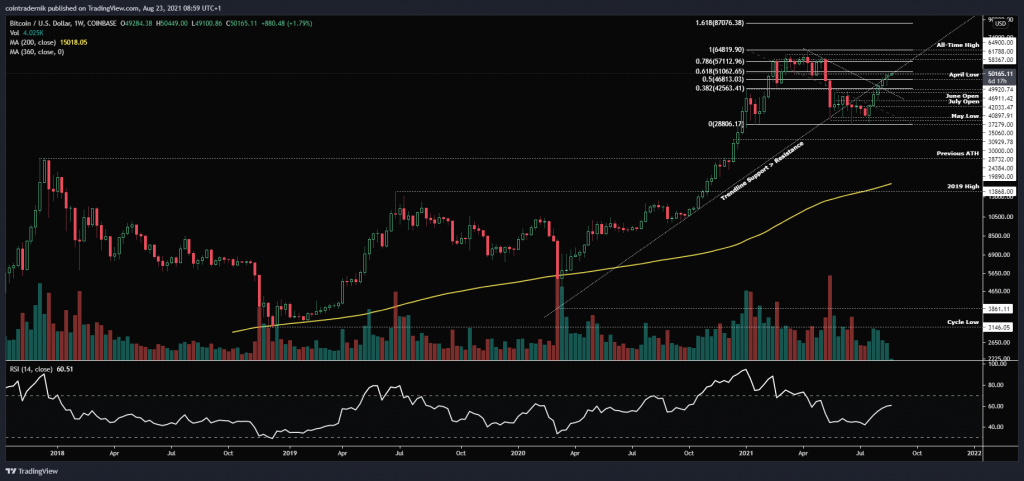
Weekly:
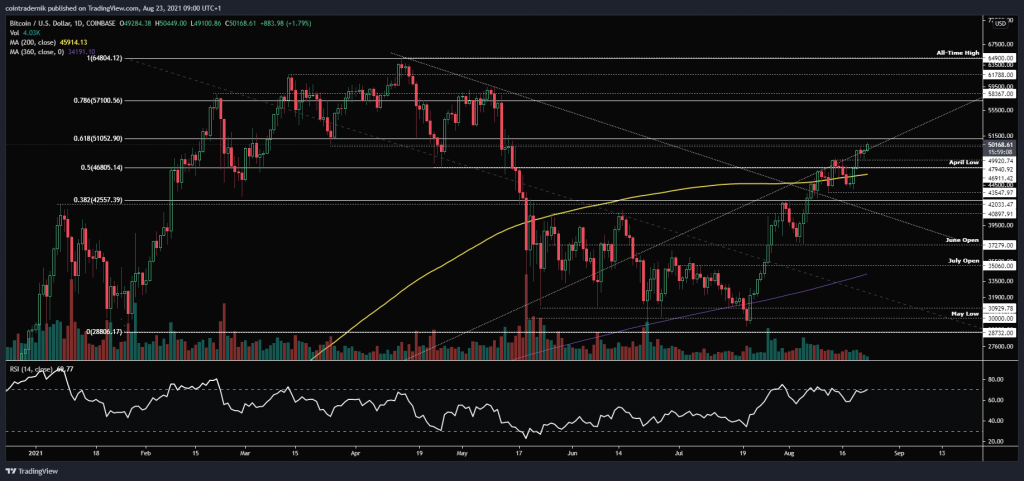
Daily:
Price: $50,187
Market Cap: $940.126bn
Thoughts: If we begin by looking at the weekly chart for BTC/USD, we can see that the rally continued last week, making it five straight green weekly candles. Price did dip as expected following the prior week’s rejection just shy of the major resistance at $50k, printing a higher low and continuing beyond the previous week’s high and closing at $49.3k. Again, as price pushes further into resistance, we are seeing declining volume on Coinbase, which is a little worrisome, but the strength of the rally to push through several key resistance levels cannot be understated. We are now tackling the big one, in my opinion, at $50k, where if BTC is able to close this week firmly above it, I would expect an even greater squeeze to follow regardless of volume all the way into the 78.6% retracement around $57k, which is where it would make a lot of sense to deleverage if you are leveraged and hedge some spot exposure also. If, however, this week sees price poke through $50k and subsequently reject and break down (a loss of ~$47k would be key here), I’d begin considering the possibility of the rally cooling off here and price perhaps making its way back towards the range breakout around $42k before forming a new base for another crack at $50k+.
Dropping into the daily, the structure on the pushes higher is super clean, as we saw the April low at $46.9k cap price on the first attempt, price made a higher low at $43.5k and then rallied straight through the high and rejected at $48k, again making a higher low last week above $43.6k and reversing the dip in two days of rallying. Price then retested that $48k high as support this weekend and is now pushing through the $50k level, and between here and the 61.8% retracement at $51k I expect we will find significant resistance on the first test given the declining volume. Whilst market structure remains bullish and price continues to print higher highs and higher lows, however, there is no reason to expect the rally to end – if anything, what we may find is that price rejects between here and $51k, forms another higher low above the 200dMA and then pushes through $51k to squeeze towards $57k. For bears, rejection up here has to be followed by a break in bullish market structure, where at present this would require a break below $43.7k, but at that point the risk reward to short back into the range high at $42k is likely not worth it unless the lower timeframes present a clean setup. For bulls this week, I would be interested in buying a sweep of the weekend lows at $48k if that dip comes…
Ethereum:
ETH/USD
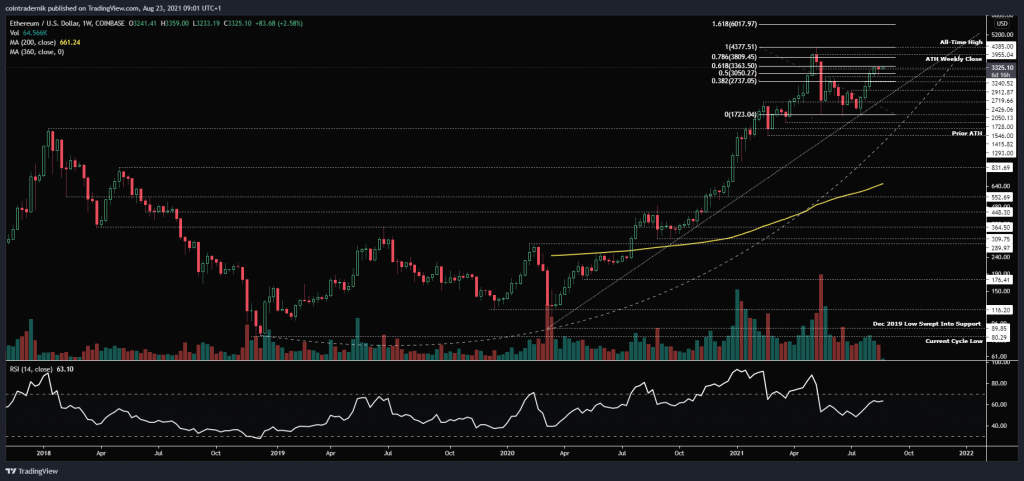
Weekly:
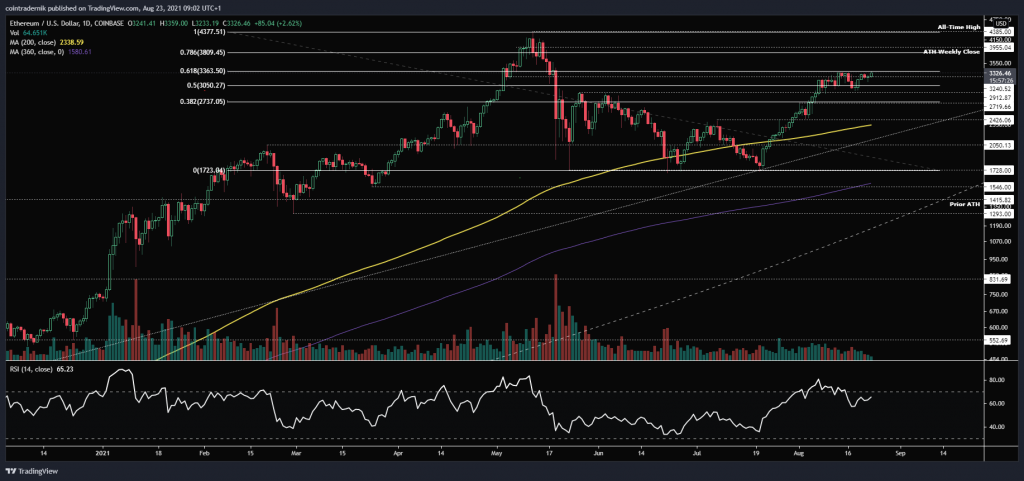
Daily:
ETH/BTC
Weekly:
Daily:
Price: $3339 (0.0664 BTC)
Market Cap: $391.274bn
Thoughts: Beginning with ETH/USD, we can see from the weekly that the pair finally consolidated following its four-week rally, with resistance at the 61.8% retracement level ~$3360 providing significant resistance at present. However, last week did see price retest prior resistance at $2913 as support and the level held firm, with price then reversing the dip to close the week back at $3240. Given the demand found last week on the dip, and the fact that price is just lingering below resistance on low volume, I am expecting $3360 to give way this week and for the pair to continue higher towards $3810, assuming the break beyond $3360 does not print a swing-failure on the daily timeframe. If we drop into the daily, we can see that the pair has formed a range where prior resistance at $2913 is now range support and resistance is being found at $3360, which also happens to be the daily open price of the capitulation candle. As I mentioned last week, I would like to see a strong close beyond $3360 to confirm continuation towards the 78.6% fib and beyond, as any swing-failure and subsequent breakdown above $3360 would look a little bearish, where I would then expect the bottom of the range to be taken out at the very least, if not a retest of support at $2720. For now, onwards and upwards for ETH.
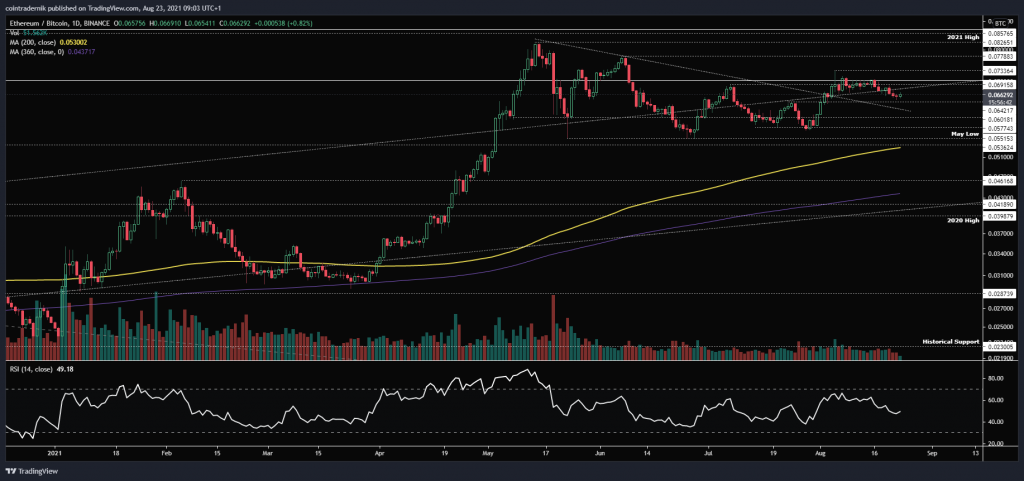
Turning now to ETH/BTC, last week was again the first red candle in several weeks, but as has been the case now since the return to bullish market structure on the break above 0.069, the pair is simply chopping and consolidating between two key levels, which we can see more clearly on the daily. Here, we can see that prior resistance at 0.064 is now acting as support and price is finding resistance around 0.07. Whilst we remain in this range, I am sitting on my hands, but I am certainly leaning towards a bullish breakout given the weekly structure. If we do see 0.07 closed beyond, I’d expect to see continuation higher into 0.078 from there. For bears, a loss of the 0.064 range support here would likely lead to another 10-15% drop towards the July support around 0.058, which is the last stand before the May lows; if those gave way, it becomes an entirely different picture, as the weekly structure shift would have failed and we’d be looking at a period of underperformance at least into 0.046 in my opinion.
Tron:
TRX/USD
Weekly:
Daily:
TRX/BTC
Weekly:
Daily:
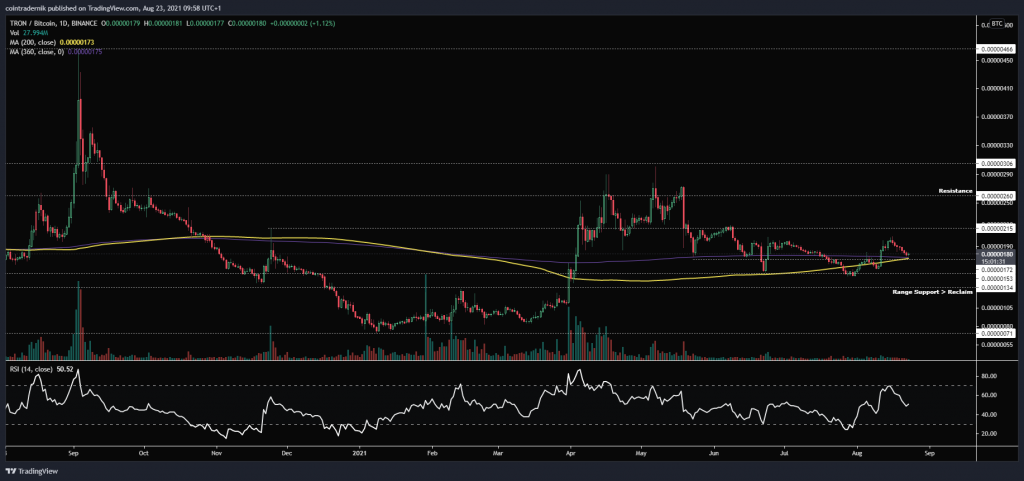
Price: $0.091 (181 satoshis)
Market Cap: $6.541bn
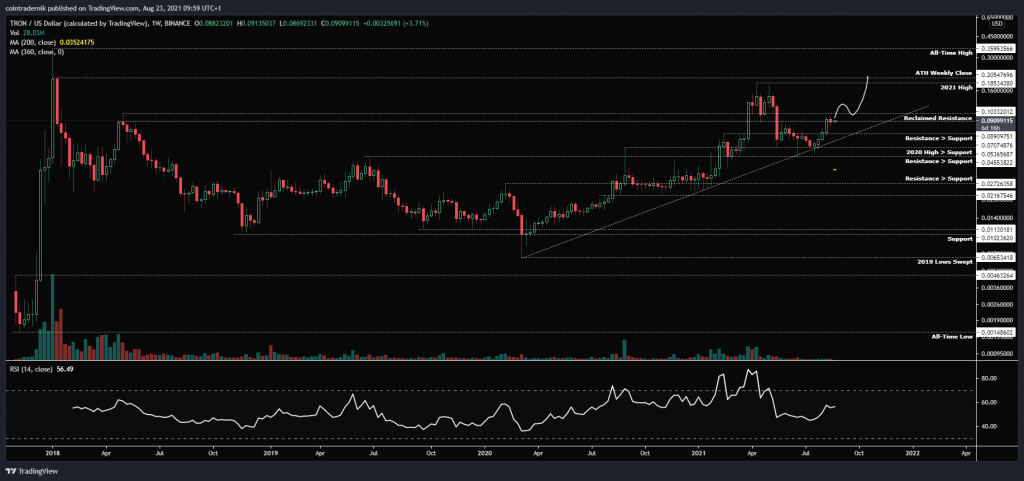
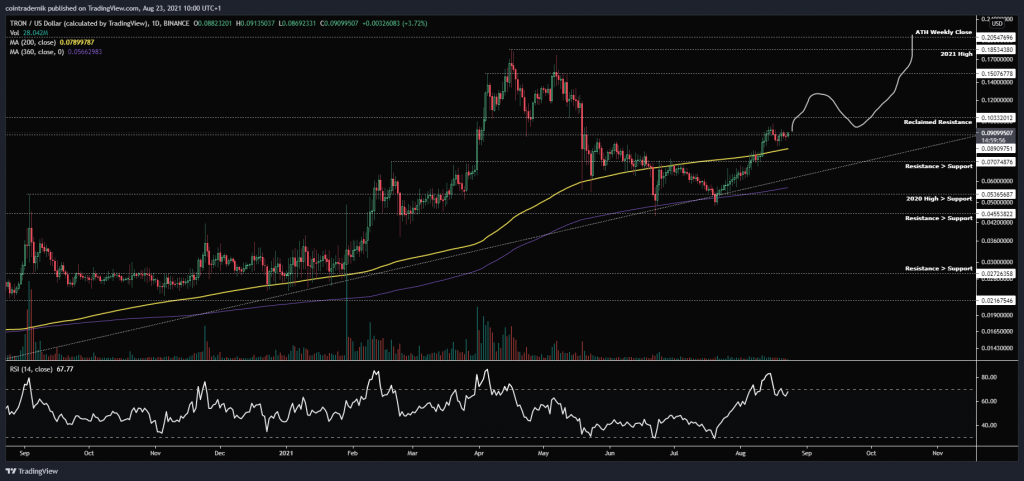
Thoughts: Beginning with TRX/USD, we can see from the weekly that the pair continues to behave extremely well, having found support at the confluence of prior resistance and trendline support and since rallied beyond $0.07 (which was acting as resistance) into the next major resistance zone between $0.089 and $0.10. This zone marked the complacency top in April 2018 and also marks the breakdown area from the 2021 highs, so any indication that this area is going to be flipped as support would be very bullish. In fact, if we see a weekly close above $0.10, Tron would be in dip buying mod all the way into new yearly highs and the all-time high weekly close at $0.21. Dropping into the daily, I have marked this out more clearly, where I would want to see a strong push beyond the resistance zone and then look to buy a rounded retest in a couple of weeks time if that dip comes.
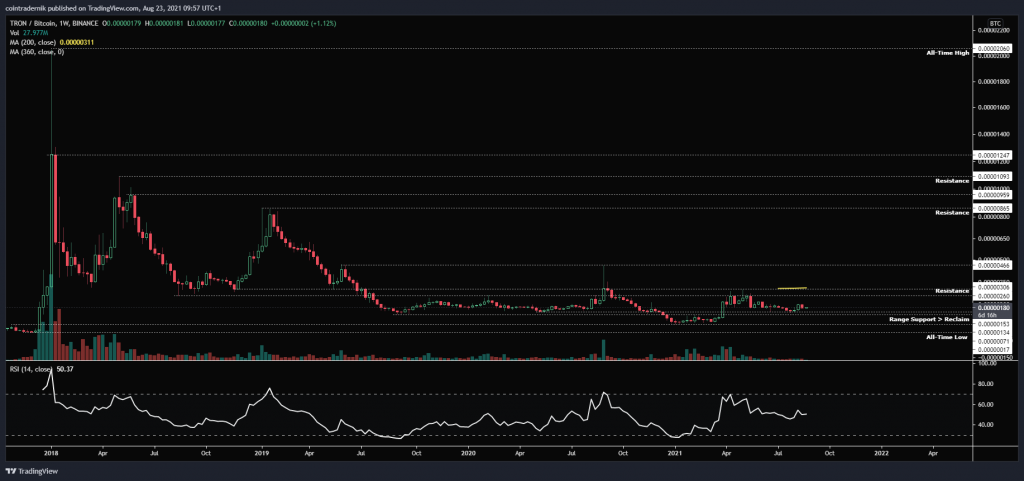
Turning to TRX/BTC, though the pair has bounced a little off of support at 153 satoshis, it remains in a tight consolidation, but as I mentioned a few weeks ago this is the ideal environment for spot buys; you want to see tight weekly ranges above historical support, and that is precisely what we are seeing. If we look at the daily for clarity, we can see that the 200dMA and 360dMA are now converging following the recent push higher, with price now looking to find support at the confluence of prior resistance and the two MAs at 172 satoshis. I have added to my spot position here and my invalidation would be a daily close below 134. I am now looking for another push higher to follow, with 215 as key resistance; flip that an I think we rally into 260 satoshis, followed by the May 2021 high at 306.
Cosmos:
ATOM/USD
Weekly:
Daily:
ATOM/BTC
Weekly:
Daily:
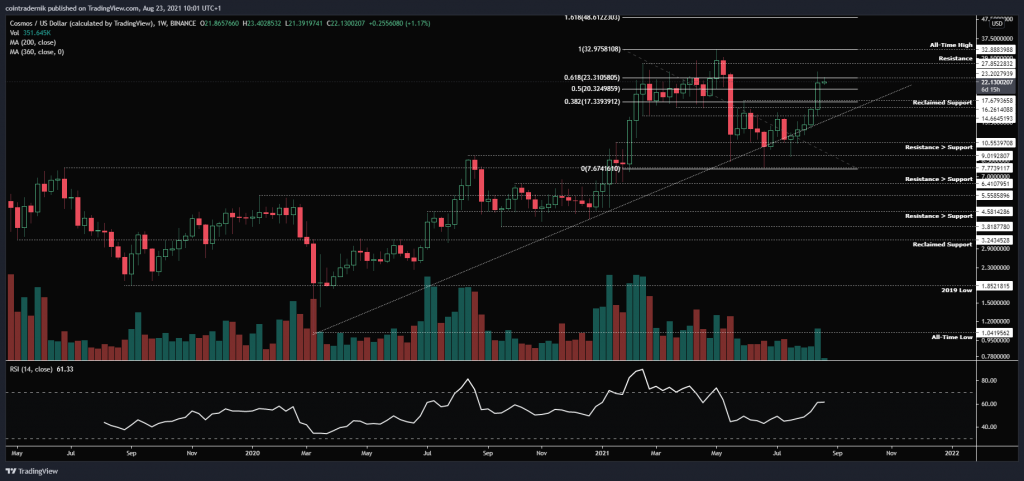
Price: $22.21 (44,130 satoshis)
Market Cap: $4.9bn
Thoughts: Looking firstly at ATOM/USD, on the weekly we can see that the pair had been expanding higher along the long-term trendline support for several weeks but remained capped by prior support turned resistance between $14.66 and $16.26, until last week, when the former level became support and ATOM pushed back inside the Q1 2021 range, rallying through resistance at $17.68 as high as $25, before ultimately closing the week just below the 61.8% retracement at $23.30 on the highest volume in several months. This is a clear sign of strength, and I’d now be looking to play this back into key resistance at $27.85 followed by all-time highs at $32.88 should the first level give way. If we look at the daily, a perfect setup would be for price to retrace back towards the 200dMA and reclaimed support above $17 from here, where I would look for longs all the way into $28.
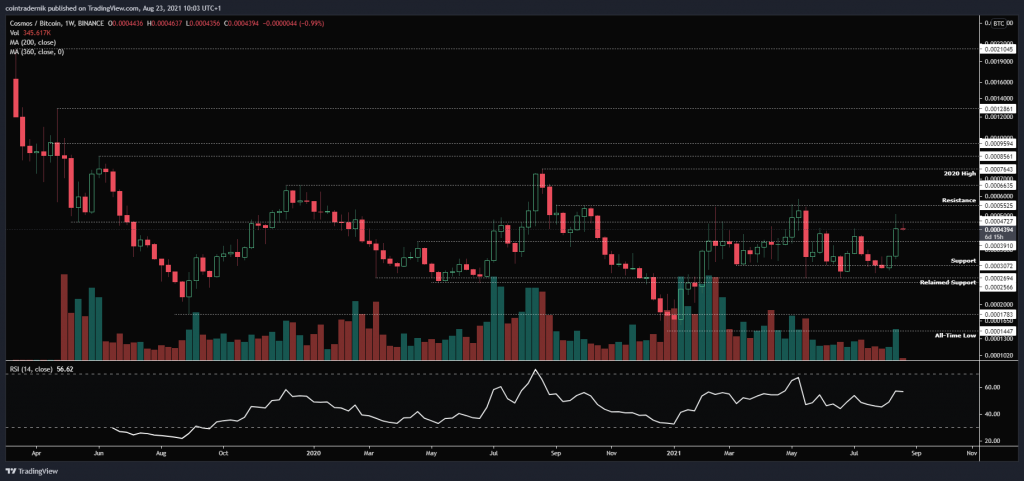
Turning to ATOM/BTC, as has been the case for the entirety of 2021, the pair remains range-bound, continuing to find support above 25.7k satoshis and remaining capped by 55.3k satoshis. Within that range, the bulk of the price-action has been occurring between 30.7k as support and 47.3k as resistance. Last week saw the pair take another crack at 47.3k but failed to close above, and I think it is a matter of time now before that resistance gives way. Bulls will want to see a weekly close above 47k to open up the likelihood of a 55.3k test, which has capped price since September 2020. Once that level gives way – and it will likely do so as the Dollar pair is at or has breached all time highs – I think ATOM goes for another parabolic run.
Algorand:
ALGO/USD
Weekly:
Daily:
ALGO/BTC
Weekly:
Daily:
Price: $1.17 (2334 satoshis)
Market Cap: $3.835bn
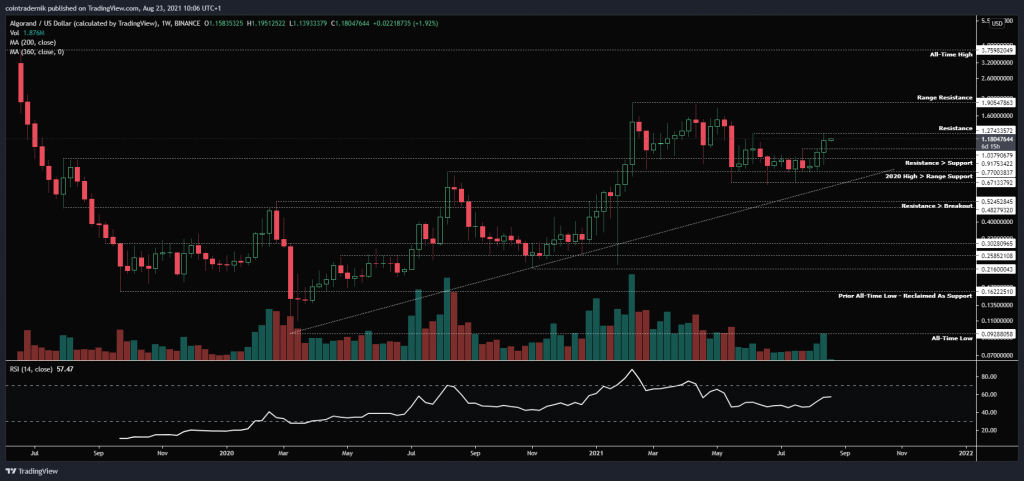
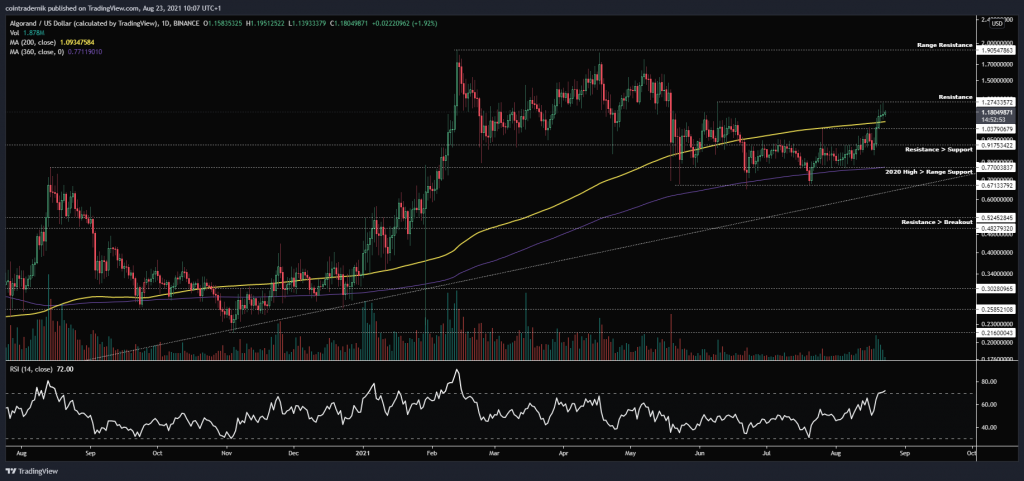
Thoughts: Beginning with ALGO/USD, we can see from the weekly that the pair rallied beyond the reclaimed resistance that had been capping price at $0.92, closing through it the week before last and then retesting the area as support last week before pushing all the way into resistance at $1.27. Weekly volume is rising as resistance is broken, which is promising to see. From here, we would want to see $1.27 give way at the weekly close, and then those on the sidelines should be looking to long any dip back into the level to play into range resistance at the 2021 high ~$1.91. I fully expect that resistance to give way when we consider that ALGO has technically been range-bound between support at $0.77 and resistance at $1.91 since February and I would not want to fade that breakout. I am now leaning heavily towards the idea that wee see new dollar all-time highs for ALGO later this year and will be positioning for that possibility.
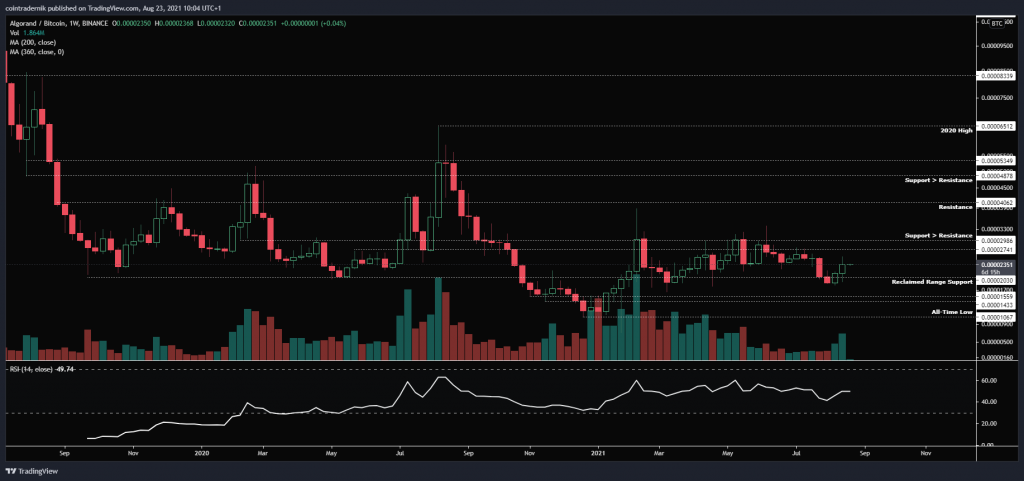
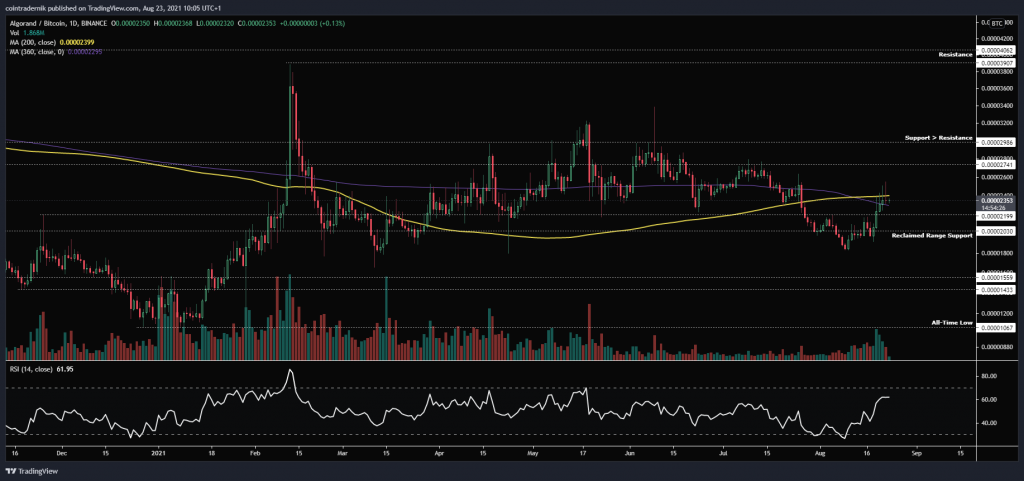
Turning to ALGO/BTC, again much like ATOM it has been trapped inside a range for the bulk of 2021, breaking briefly below range support at 2000 satoshis a couple of weeks ago but then reclaiming the level immediately and closing back inside the range, confirming the move as a fake-out. Now that we are back inside the range, I would look for any opportunity to buy a dip back into 2000 satoshis or as close to it as possible, looking to hold that for a retest of range resistance at 3000 satoshis, where I would look for reasons to hedge any leveraged positions in ALGO (for example, if it aligns with resistance on the Dollar pair and I am positioned in perps), but I would continue to hold spot. Once we see a weekly close beyond 3000 satoshis, I will look to add to my spot position on any retest of that level, as it would be a significant resistance to flip as support and I would expect the pair to continue to 4100 satoshis from there, if not the August 2020 resistance zone between 4900 and 5350 satoshis.
Synthetix:
SNX/USD
Weekly:
Daily:
SNX/BTC
Weekly:
Daily:
Price: $14.06 (27,920 satoshis)
Market Cap: $1.615bn
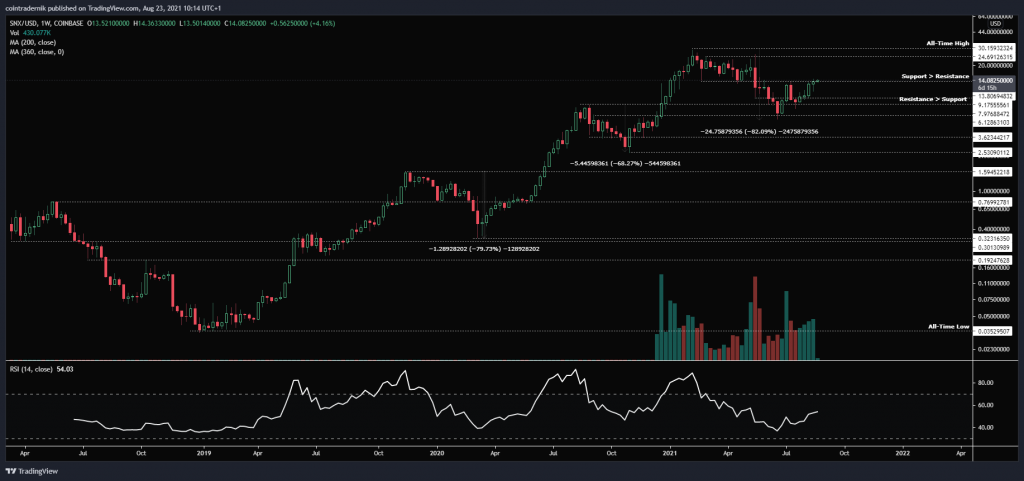
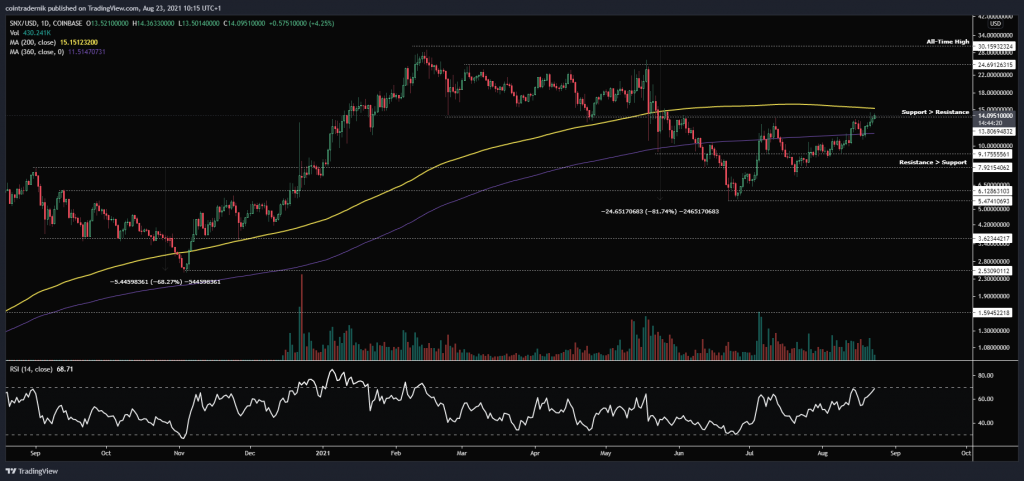
Thoughts: Beginning with SNX/USD, we can see from the weekly that this pair in particular has been very uniform in the cycles it has had, and it now appears that – following an 82% retracement – the pair is entering disbelief for another cycle higher. However, despite successfully flipping the previous cycle highs as support around $9.20, the pair is now pressing up against the breakdown area – prior support turned resistance at $13.80. Before SNX holders get too excited, this is a key level to be flipped on the weekly. Close the weekly above it and I think the pair rallied all the way back into major resistance at $24.70, which if it can climb above will leave only the all-time high at $30.16 as resistance before more price discovery. Dropping into the daily, the 200dMA is also capping price here, thus strengthening the case that once this area is flipped it will become the base for the next leg higher into $24.70. If we see the pair reject in this area, I would look to buy a dip back into the 360dMA to form a higher low within this trend.
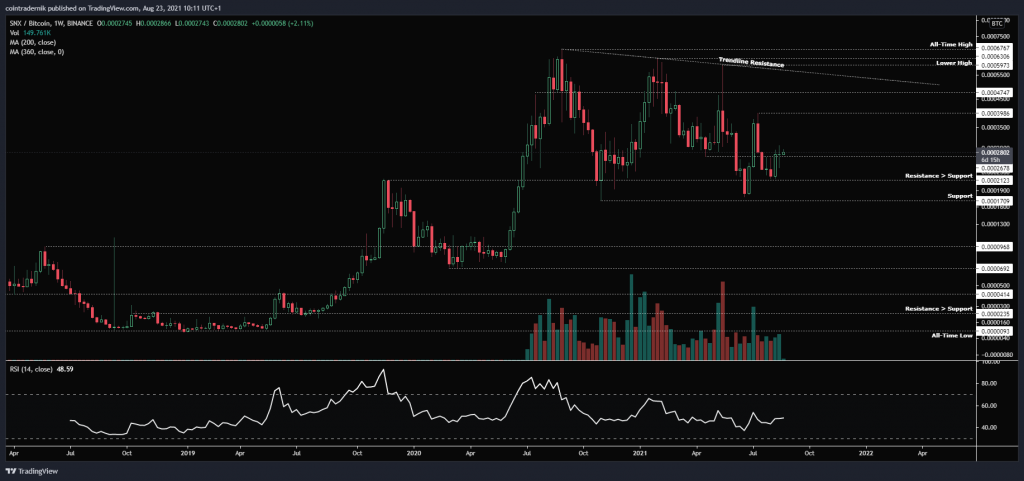
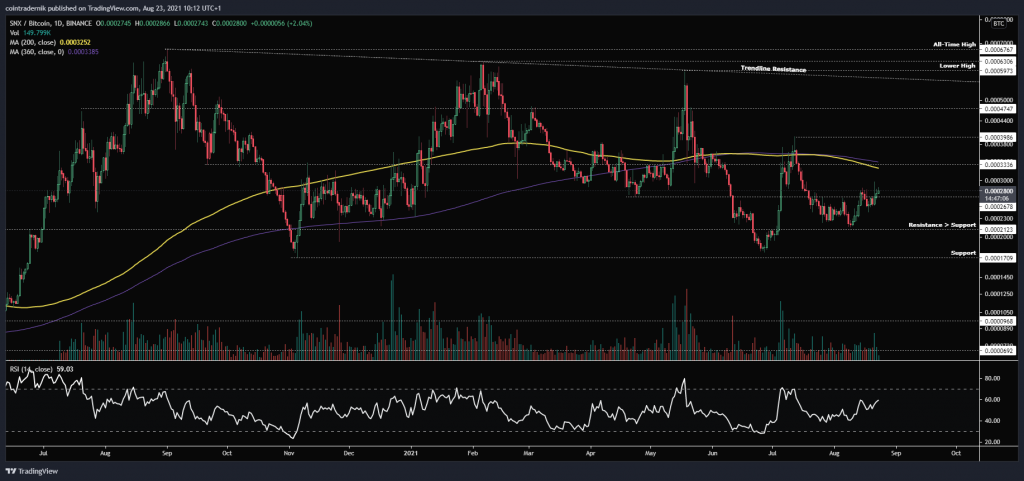
Turning to SNX/BTC, the pair has just reclaimed prior resistance at 21.2k satoshis as support, printing a higher-low on the weekly above range lows at 17.1k. As can be seen on the weekly, the pair has continued to put in lower-highs also. As such, I would be looking for the most recent lower high at 40k satoshis to be closed above to confirm bullish market structure, which would then indicate to me that the BTC pair wants to move towards that trendline resistance that has capped price since the all-time high. For a longer-term outlook, only a weekly breakout above that trendline resistance would begin looking super bullish to me and is likely what will drive the dollar pair into its 4th bullish cycle of price discovery.
Harmony:
ONE/USD
Weekly:
Daily:
ONE/BTC
Weekly:
Daily:
Price: $0.12 (240 satoshis)
Market Cap: $1.264bn
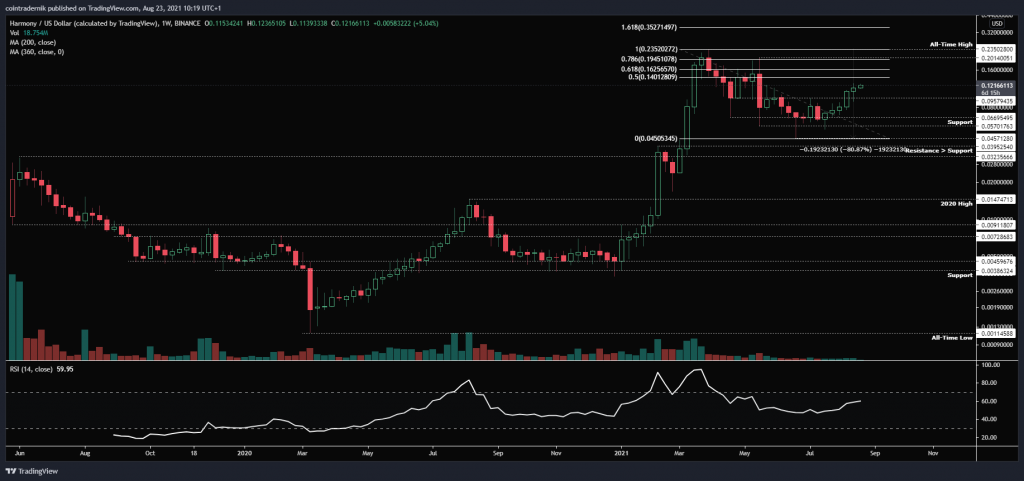
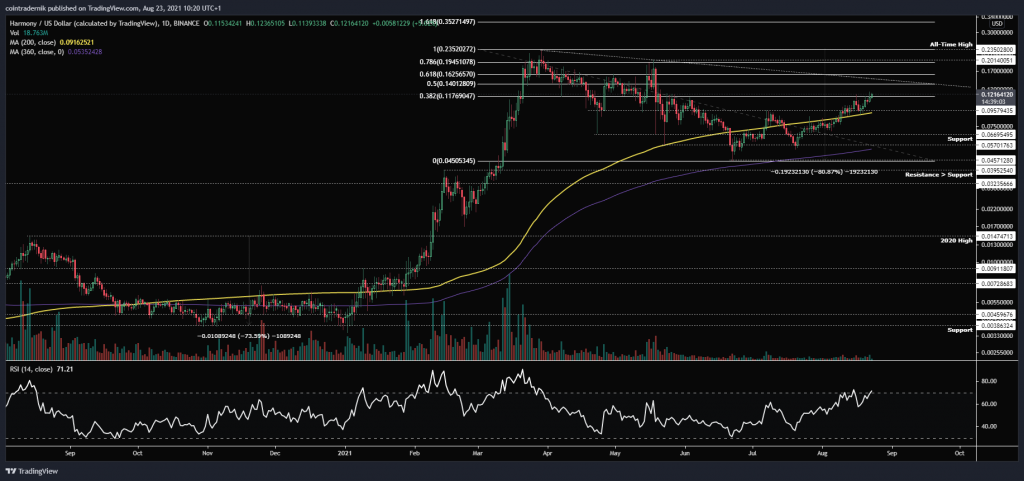
Thoughts: Beginning with ONE/USD, we can see from the weekly that the pair retraced 81% from the all-time high but failed to close below support at $0.067, despite numerous attempts and wicks through the level as low as $0.045. Price bounced off the support level and rallied into the breakdown area at $0.096 a coupe of weeks and subsequently broke through the level, with price last week retesting it as reclaimed support and continuing higher. The pair is now finding some resistance below the 50% retracement at $0.14, but if we look at the daily we can see that the 200dMA has been reclaimed as support and is pushing the pair higher. Over the next couple of weeks, I expect we will see price retest trendline resistance from the all-time high as the 50%-61.8% fibs come into play, and bulls should be looking for a breakout beyond the trendline followed by a successful retest as support to play this higher into the lower high from May at $0.195.
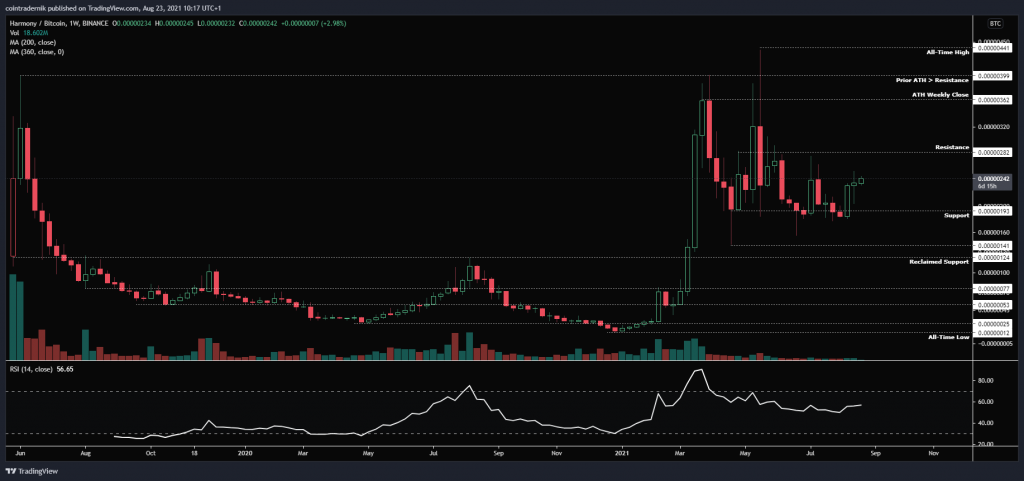
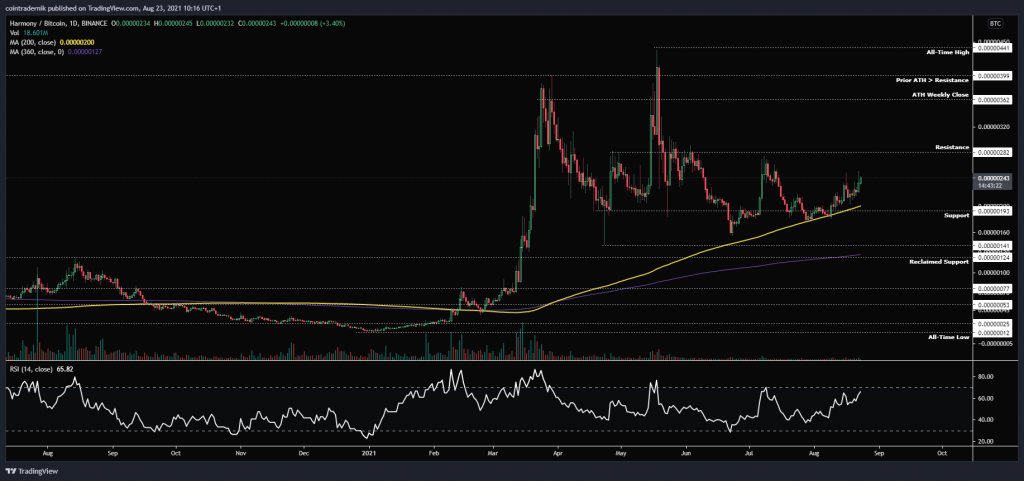
Turning to ONE/BTC, the pair has been finding support at 193 satoshis since April, with local resistance coming in at around 280 satoshis. If ONE can push on from here beyond 280, I’d expect to see another leg higher into the major resistance cluster for this year between the all-time high weekly close and the prior all-time highs ~360 to 400 satoshis. Looking at the daily, the 200dMA is supporting the pair higher and so I would look at any dip back into the MA as an opportunity for an entry, with risk-averse speculators better to wait for 282 to give way and then enter with invalidation below the 200dMA.
Reserve Rights:
RSR/USD
Weekly:
Daily:
RSR/BTC
Weekly:
Daily:
Price: $0.053 (104 satoshis)
Market Cap: $691.017mn
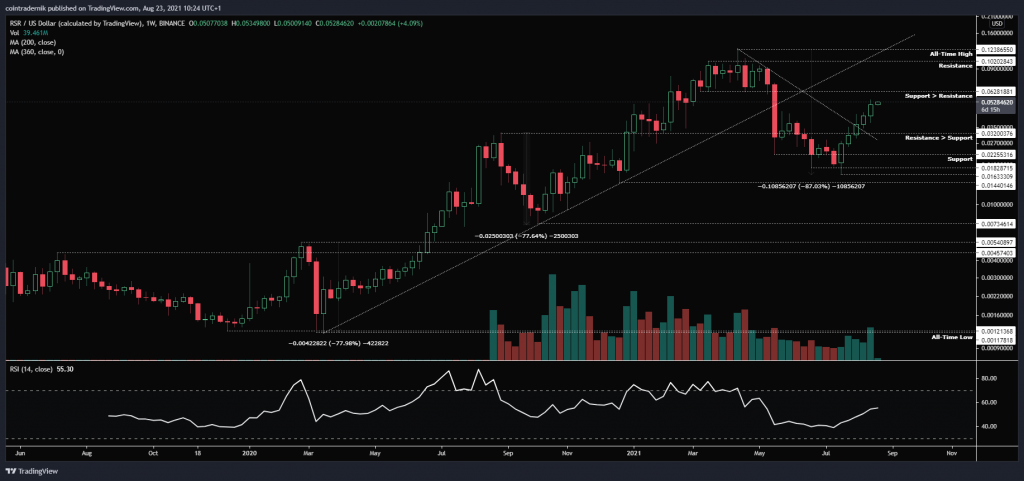
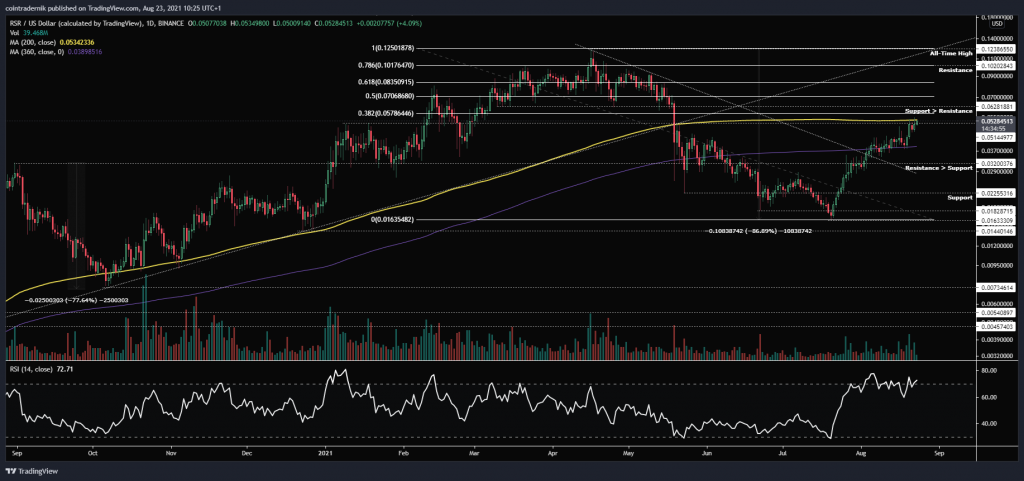
Thoughts: If we look firstly at RSR/USD, we can see on the weekly that the pair retraced 87% from its all-time high, breaking down below trendline support and printing a three drive accumulation pattern into support at $0.016 before it found a bottom. Since, the pair has been rallying hard, reversing with a bullish engulfing off the bottom and then closing back above prior resistance turned support at $0.032. Subsequently, the pair broke out above trendline resistance from the all-time high and is now pushing towards the key level – the breakdown area prior to capitulation at $0.063. I expect this level to provide significant resistance on the first attempt, with the zone between current prices and that level also containing the 38.2% retracement and the 200dMA. This is a vital area to flip as support if RSR wants to continue the trend higher and I’d look to buy heavy once we see $0.063 flipped, looking to then play that all the way back towards $0.10.
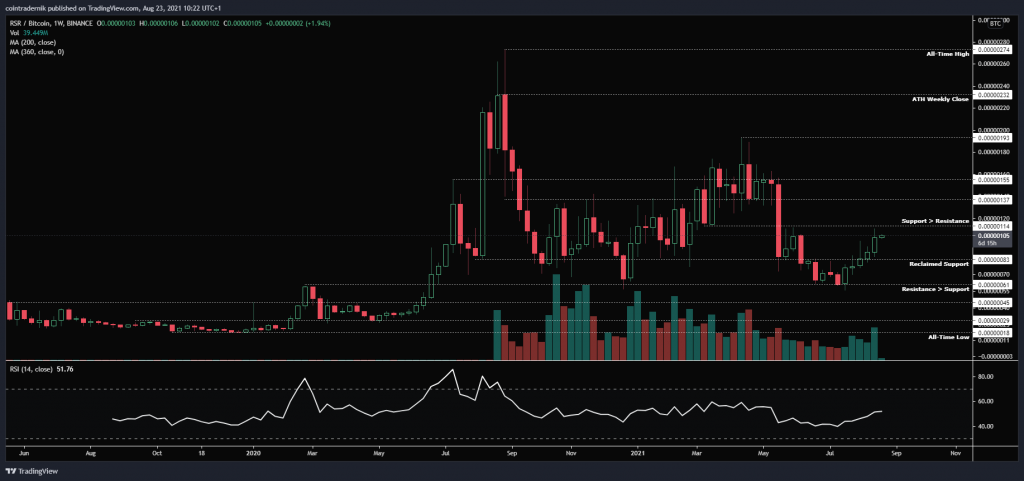
Turning to RSR/BTC, the pair continues to find support above prior resistance at 61 satoshis and bounced to reclaim support at 83 satoshis, with the pair now capped by prior support at 114. If we look at the daily, we can see that both the 200dMA and 360dMA are also sitting right here at 114, and so again I am looking for a clean break above the level on good volume before looking to buy any dips, with 137 satoshis the next resistance above. Flip that and I think the July high at 155 will be retested, where any break through that level would be a clear sign for new yearly highs. Alternatively, if the pair rejects at the overhead resistance, I would look to buy any dip back into 83 for the bounce and retest of the resistance cluster at 114.
COTI:
COTI/USD
Weekly:
Daily:
COTI/BTC
Weekly:
Daily:
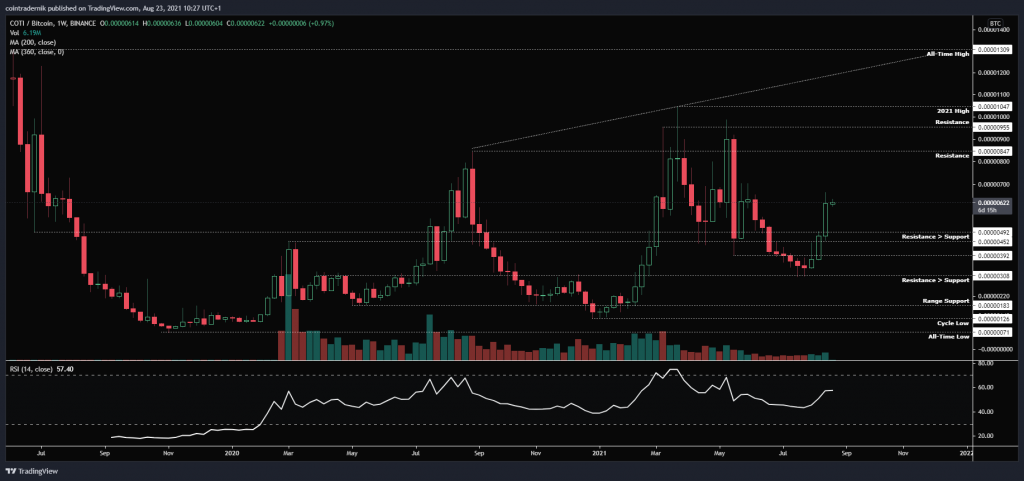
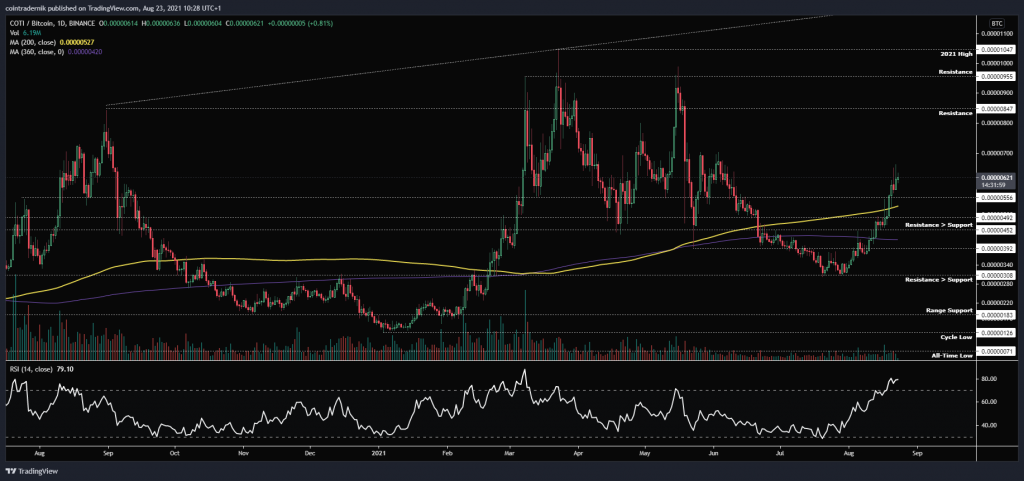
Price: $0.31 (621 satoshis)
Market Cap: $271.2mn
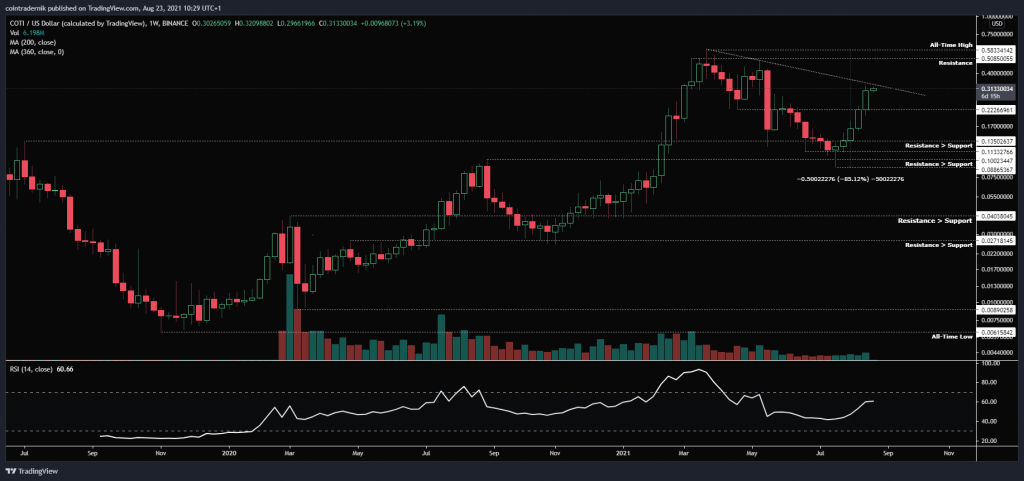
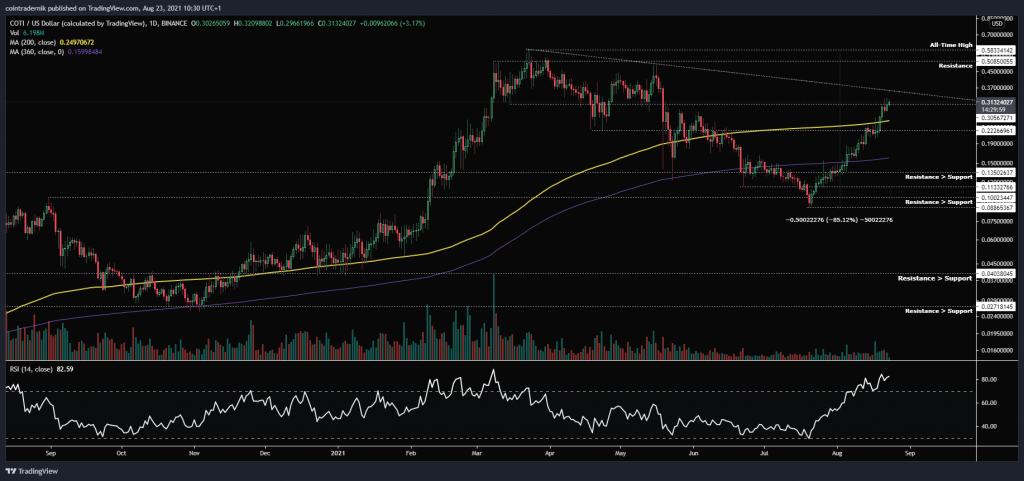
Thoughts: If we begin with COTI/USD, we can see that the pair has extended off the bottom with expansive weekly ranges, rallying all the way into trendline resistance last week following the reclaim of support at $0.22. I would expect to see the pair consolidate here for a week or two perhaps, with any breakout beyond the trendline confirming that the pair wants to retest major resistance at $0.50. Close the weekly above $0.50 and I think we see another cycle of price discovery commence, with $0.80 as my first target as the 1.618 extension of the high. Dropping into the daily, we can see that the 200dMA has been reclaimed also, followed several days of contesting with it as resistance, and I would consider any dip from current overhead resistance back into the 200dMA as a buying opportunity for the trendline breakout.
Finally, looking at COTI/BTC, we can see the strength of the pair following the test of prior resistance as support at 308 satoshis, with COTI rallying back through the important pivot between 450 to 490 satoshis soon after, where last week 450 satoshis became support for the bounce and price closed at 614. I think we will see the pair continue to outperform now that the pivot cluster has been reclaimed as support, and I would look at any dip back into 492 as an opportunity for those on the sidelines to enter, with the next major resistance overhead at 850 satoshis, followed by 955.
And that concludes this week’s Market Outlook.
I hope you’ve found value in the read and thank you for supporting my work!
As ever, feel free to leave any comments or questions below, or email me directly at nik@altcointradershandbook.com.







Hi Nik, Can you pls provide analysis on COTI on your next market outlook.
Will do!
Hello,you can look at ETC?Thank you
Do you have some favorites to watch in NFT projects?
Will include it today – and to be honest I’m still feeling my way into the NFT space, I’ve got a few favourites that I’ve been tweeting about like HappyLand Gummy Bears, Satoshibles, CryptoSaints, HashGuise, anything on BlockArt, but I’m by no means an expert.
Hi Nik, could you analyze LTC and ZIL on your next market outlook report?
Thank you in advance,
Hector.
Absolutely