
Market Outlook #135 (26th July 2021)
Hello, and welcome to the 135th instalment of my Market Outlook.
In this week’s post, I will be covering Bitcoin, Ethereum, Cardano, Litecoin, Chainlink, Solana, Monero, THORChain and Fantom.
As ever, if you have any requests for next week, please do drop me an email or leave a comment.
Bitcoin:
Weekly:

Daily:

Price: $38,231
Market Cap: $717.490bn
Thoughts: If we begin by looking at the weekly chart for BTC/USD, we can see that last week closed with a bullish engulfing on higher volume than the preceding two weeks (albeit still relatively low), with price having found support above the $28.7k lows. If you recall from last week, I wanted to see a wick below to take out the clean double bottom in that $28.7k area, with the first swing-low there having formed in the Q1 2021 range and the second swing-low forming in June. Had we seen a sweep towards $28k, thus cleaning out all the stops that would be sitting below that double bottom, I would be feeling a lot more bullish than I currently am for the mid-term. Now, that is not to say that the reaction since (particularly that of today’s price-action) is not now pointing to a deeper squeeze, which we have all been expecting as a potential complacency shoulder since May. In fact, looking at price now, if we are able to hold above $37.3k and derivatives funding stays neutral to negative, I would expect to see those $41-42k highs finally taken out at the top of the range, with the potential for a liquidation cascade of shorts into that April low at $46.9k. The trigger for that squeeze higher into the mid-$40k region will be if we start to see price acceptance above the top of the range at $42k on the daily timeframe, in my opinion.
If, however, we sweep the top of the range this week and then begin to break down and print a swing-failure, I’d be looking for shorts all the way back to $28.7k. If, instead, we get a daily close above $42k, I’ll be looking for intraweek longs up towards $46.9k. Now, looking further ahead, should price enter that $47k area, it will no doubt have to break above trendline resistance from the all-time high and possibly even close the weekly back above range highs at $42k (a breakout above which led to bullish continuation back in February). Thus, weekly market structure would turn bullish as price has closed at a higher-high. In that scenario, it becomes much more plausible that we are on track for bullish continuation, but my primary issue with this is the fact that $28.7k was not swept – there are rarely ever free rides and certainly not prior to a charge to new all-time highs.
As such, I find myself conflicted, but I am leaning towards the following scenarios: a) Price sweeps $42k and rejects, printing a failed breakout of the range – short this back towards those clean lows at $28.7k. b) Price breaks out above $42k and closes above it on the weekly – re-enter partial spot that was sold above $48k with a hard stop on a close back inside the range. c) Price squeezes all the way into $47k+ – hedge 50% of spot exposure and un-hedge if $58k is reclaimed, getting short on derivatives if I see derivatives premiums and breakdown at resistance on lower timeframes.
Beyond the above three scenarios, this is a very confusing area for mid-term expectations. Ultimately, I would be very surprised if we left $28.7k untapped before breaking above $65k, but I have been surprised before. Short-term, however, there is no doubt that this looks like it has at least another 10% squeeze in it up into the range high, which is where I’ll begin looking for a reaction.
Turning to the daily, we can see that price is also pushing up into trendline support turned resistance, but is as of today comfortably above the June open and above the swing-high at $36.6k that preceded the slow bleed into $29k. If we can get a daily close above both of these levels, an intraday play would be to look for lower timeframe swing-lows that get swept on a pull-back towards $37.3k and get long those for the next push higher, assuming a pull-back comes before $42k is tagged. Beyond that, I am not looking for a short until the range high gets tagged and potentially swept. Looking at key resistance above the range high, that area between the 200dMA at $45k and the April low at $47k looks opportune for longs to reduce exposure.
Apologies for the longer passage there but there is a lot here to unpack at present.
Ethereum:
ETH/USD
Weekly:

Daily:

ETH/BTC
Weekly:

Daily:

Price: $2,345 (0.06189 BTC)
Market Cap: $274.625bn
Thoughts: Beginning with ETH/USD, we can see from the weekly that price once again found support around $1700, printing a triple-bottom at the level, reversing sharply and ultimately closing the week back above the local pivot at $2050, with this morning’s price-action taking the pair closer to the prior swing-high at $2426. As mentioned earlier, I am not convinced by double bottoms and triple bottoms even less so; triple bottoms right at trendline support seem even more suspect, but there is no requirement for $1700 to be taken out anytime soon just because it is now a prime liquidity area for sell stops. As such, I am now looking for a weekly close above $2426 to shift market structure bullish as we inch towards EIP-1559. If that occurs, I would be looking for a squeeze back to $2912, above which I would be looking for signs of rejection and thus potential complacency to get short back to $1700. Alternatively, if we see a weekly close above that $2900 area in the next couple of weeks on rising volume, I will shift bias to look for longs back to new all-time highs and beyond, but until I see that acceptance above $2900 I am unconvinced in the context of three clean swing-lows at $1700. Turning to the daily, the pair has reclaimed the 200dMA and is now pressing up against local support turned resistance around $2309, with the swing-high just above at $2426. If the pair is able to close the daily above that swing-high, we can look to play the range between $2426 and the double top at $2913. As aforementioned, that perfect bounce off the trendline last week without sweeping the $1728 swing-lows is not what I’d want to see for mid-term bullish continuation but I am willing to shift my bias if we are able to close and hold above those highs at $2913. Alternatively, if we see $2426 swept and swing-failure form, I will be looking for intraday shorts back into $2050 and potentially below if price can close back below that level.
Turning to ETH/BTC, as has been the case for several weeks now, price is contained within a tightening range, capped by trendline resistance and supported by the May low at 0.055. I am looking for two things over the next week or two: a) a weekly close above trendline resistance and channel resistance, leading to a move above the 0.07 swing-high and thus a return to bullish market structure or b) a weekly close below 0.055 to confirm another leg down towards 0.046 and likely as low as the 200wMA. Until either of those occurs, I am not trading the pair.
Cardano:
ADA/USD
Weekly:

Daily:
ADA/BTC
Weekly:

Daily:
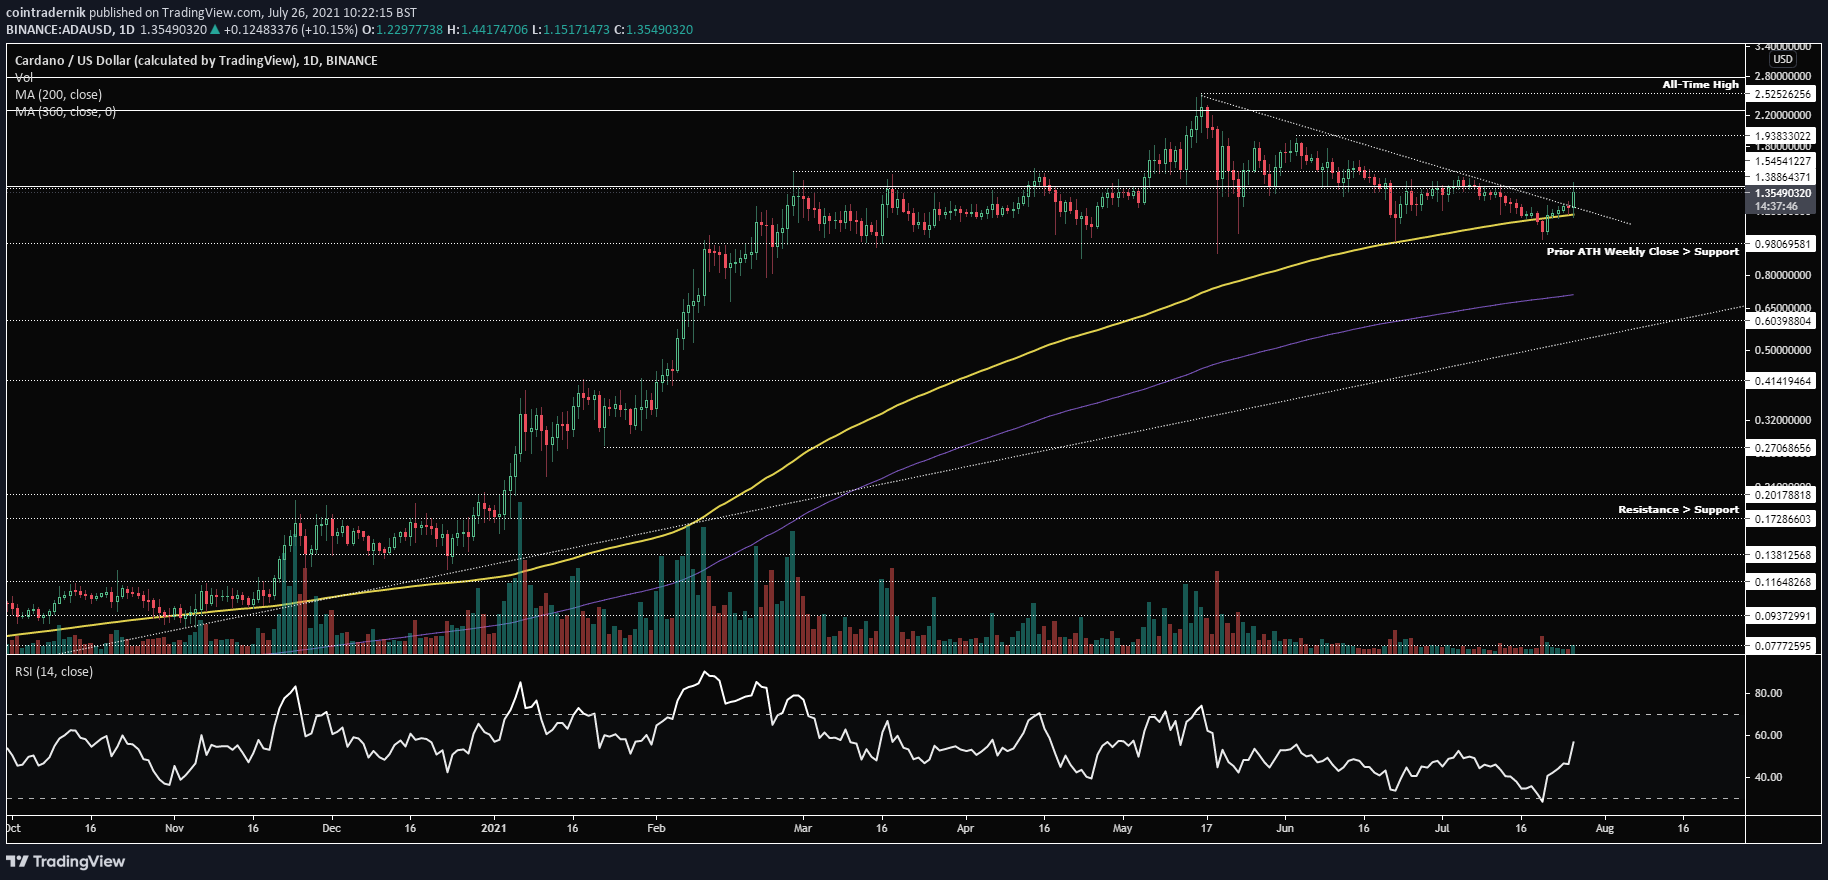
Price: $1.35 (3513 satoshis)
Market Cap: $42.856bn
Thoughts: So, if we begin with ADA/USD, you will notice that price bounced off the prior all-time high weekly close turned range support at $0.98, as it has done for months now. I mentioned last week that I would not be buying the range lows this time in anticipation of a breakdown and would instead wait for a close below $0.98 to look for shorts. Buyers instead did step in again at the level and price closed near weekly highs, back inside the previous week’s range. As of today, it is looking like the pair is breaking out above trendline resistance, but I am looking at that $1.55 area as key resistance before we can get excited about any longs (and, if you did buy the range support, that would be a great spot to reduce exposure). If we see price continue to squeeze higher and close above $1.55 this week, I’d be looking for longs next week into $1.94 and potentially a new all-time high depending on the reaction at that former level. However, if we look at the daily, whilst we can see that price faked a breakdown below the 200dMA before reversing, I am looking for a similar fake-out at $1.55 to enter a short. If I see a swing-failure of that area and subsequent breakdown on lower timeframes, ideally with positive funding on derivatives, I will be looking to play it back down towards the 200dMA and potentially as low as range support, covering there until we get a clear breakout.
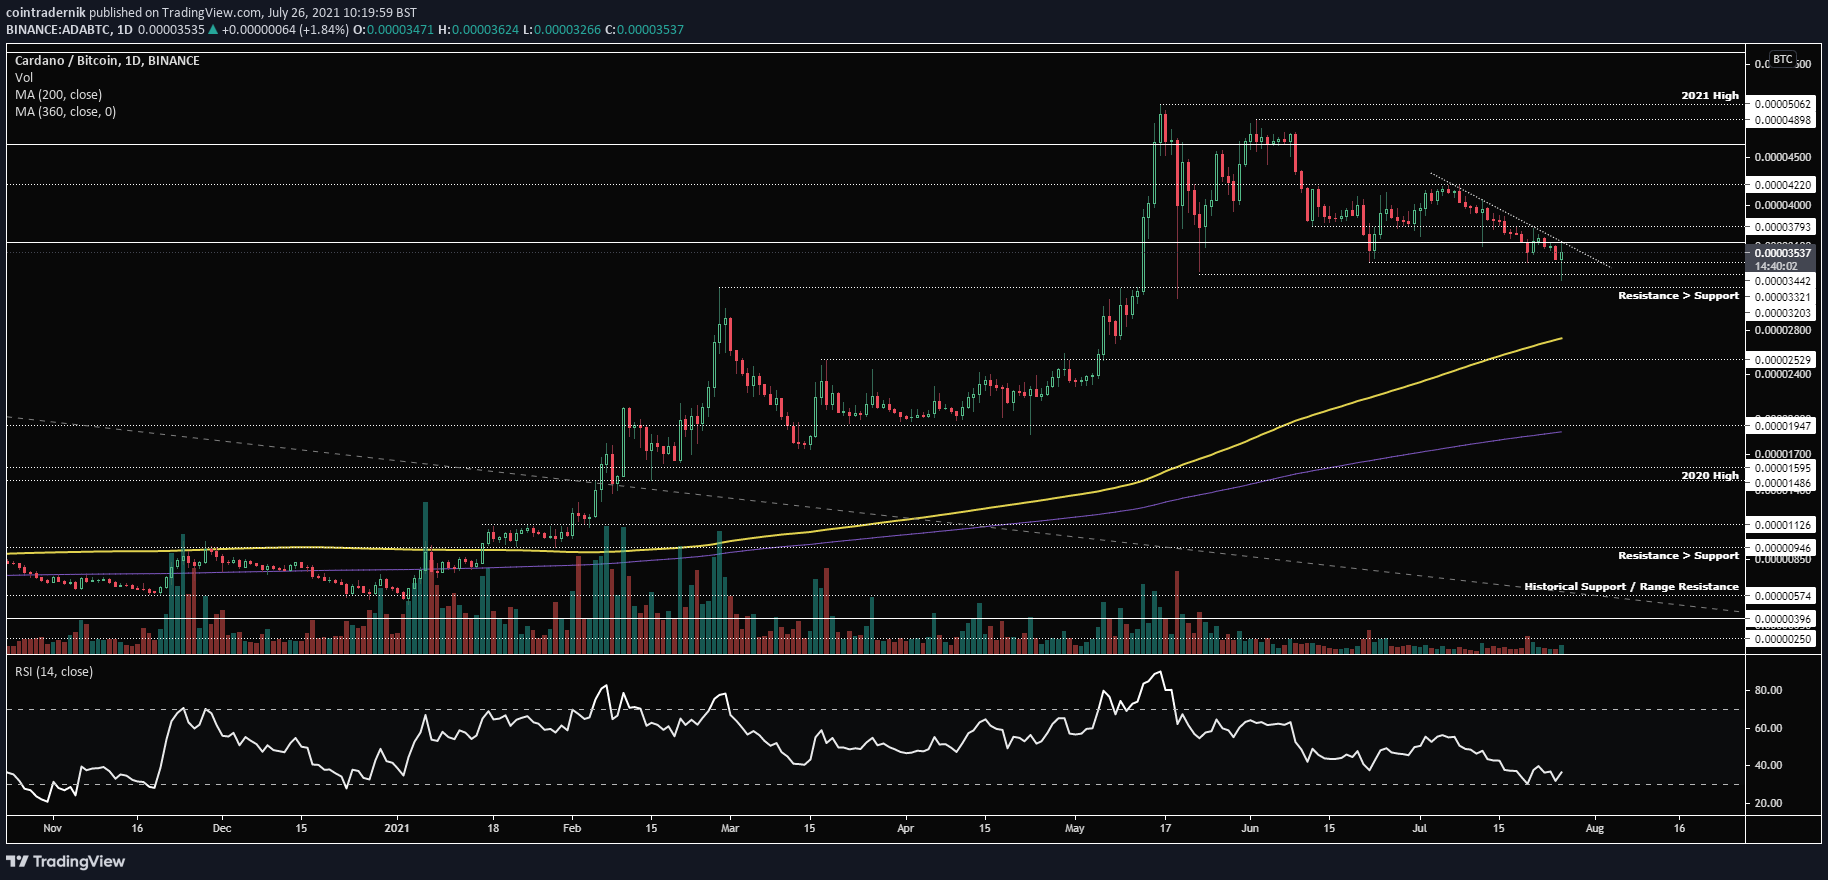
Turning to ADA/BTC, price actually closed last week at weekly lows, having sold off from resistance at 3800 satoshis into support at 3442. Price, as of today, has swept last week’s low into resistance turned support at 3200, which appears to be holding for now. However, for bulls to really take charge again, I’d want to now see the previous three weeks of selling eroded, with price closing back above 4220, which would indicate to me that we are ready for another leg higher, potentially as high as the ATH weekly close at 6100 satoshis over the next couple of months. If we fail to see that reaction from this low, I’d expect a lower high to form and form price to sell off back towards 3200, with any break below that leading to significant further downside. Dropping into the daily, we can see that the pair is pressing up against trendline resistance from the lower-high at 4220 satoshis, with a breakout above this likely to accelerate the squeeze into minor resistance at 3800. If we then see a daily close above 3800 satoshis I would expect to see that 4220 area retested, with a swing-failure there providing a tradeable setup for shorts back towards 3440. If ADA can’t pop up above trendline resistance or beyond 3800, however, I expect the 3200 floor to give way sooner rather than later, with the 200dMA the next support below at 2800 satoshis.
Litecoin:
LTC/USD
Weekly:

Daily:

LTC/BTC
Weekly:

Daily:

Price: $137.79 (0.0036 BTC)
Market Cap: $9.2bn
Thoughts: If we begin with LTC/USD, from the weekly we can see a more bullish bottoming pattern than on a number of large-caps, with three drives lower beginning with May capitulation into $116, followed by a swing-failure of that low into $106 and another swing-failure last week into $104; all of this downside rejection occurring inches away from the 200wMA. Price printed a bullish hammer and closed back above $116, below which price has failed to close since 2020, but on relatively low volume. Nonetheless, the price-action is indeed bullish and price is now pushing towards reclaimed resistance at $147. I am looking for a weekly close above this level to look for intraweek longs next week into the next resistance area at $183; close above that and I think we squeeze back towards $219, which is the origin of the breakdown. For longer-term bulls, it is up there that you would be looking for a reclaim of the breakdown level to indicate trend continuation to new all-time highs. If we see that occur, I’d be looking to buy a pull-back following the reclaim and hold the long back towards $328 as a first target.
Turning to LTC/BTC, the picture here is a little less attractive, although price is now approaching historical support, which is promising. That said, looking at the weekly, we see the 0.003475 to 0.00362 area holding as support, above the April low at 0.003227. This structure here is critical, as price found a bottom here in April then rallied above significant resistance at 0.00545 to turn market structure bullish and print a yearly high at 0.00723. If we can hold above the April low and print a macro higher-low, I would be looking to play the pair back into resistance at 0.00545, with any acceptance above that level likely to lead to another higher-high above the yearly high, with the next resistance at 0.00817. If, however, price fails to hold here, there is only the all-time low below at 0.00303. Briefly turning to the daily, I would like to see 0.00374 reclaimed following this push off of 0.00347 to confirm that bulls are taking charge here by reclaiming the May capitulation low. From there, I’d look to buy and hold for a 15-20% bounce into the confluence of resistance at 0.004395, where the 200dMA and 360dMA sit. Close above that and we get another 25% bounce into 0.0055.
Chainlink:
LINK/USD
Weekly:

Daily:
LINK/BTC
Weekly:
Daily:

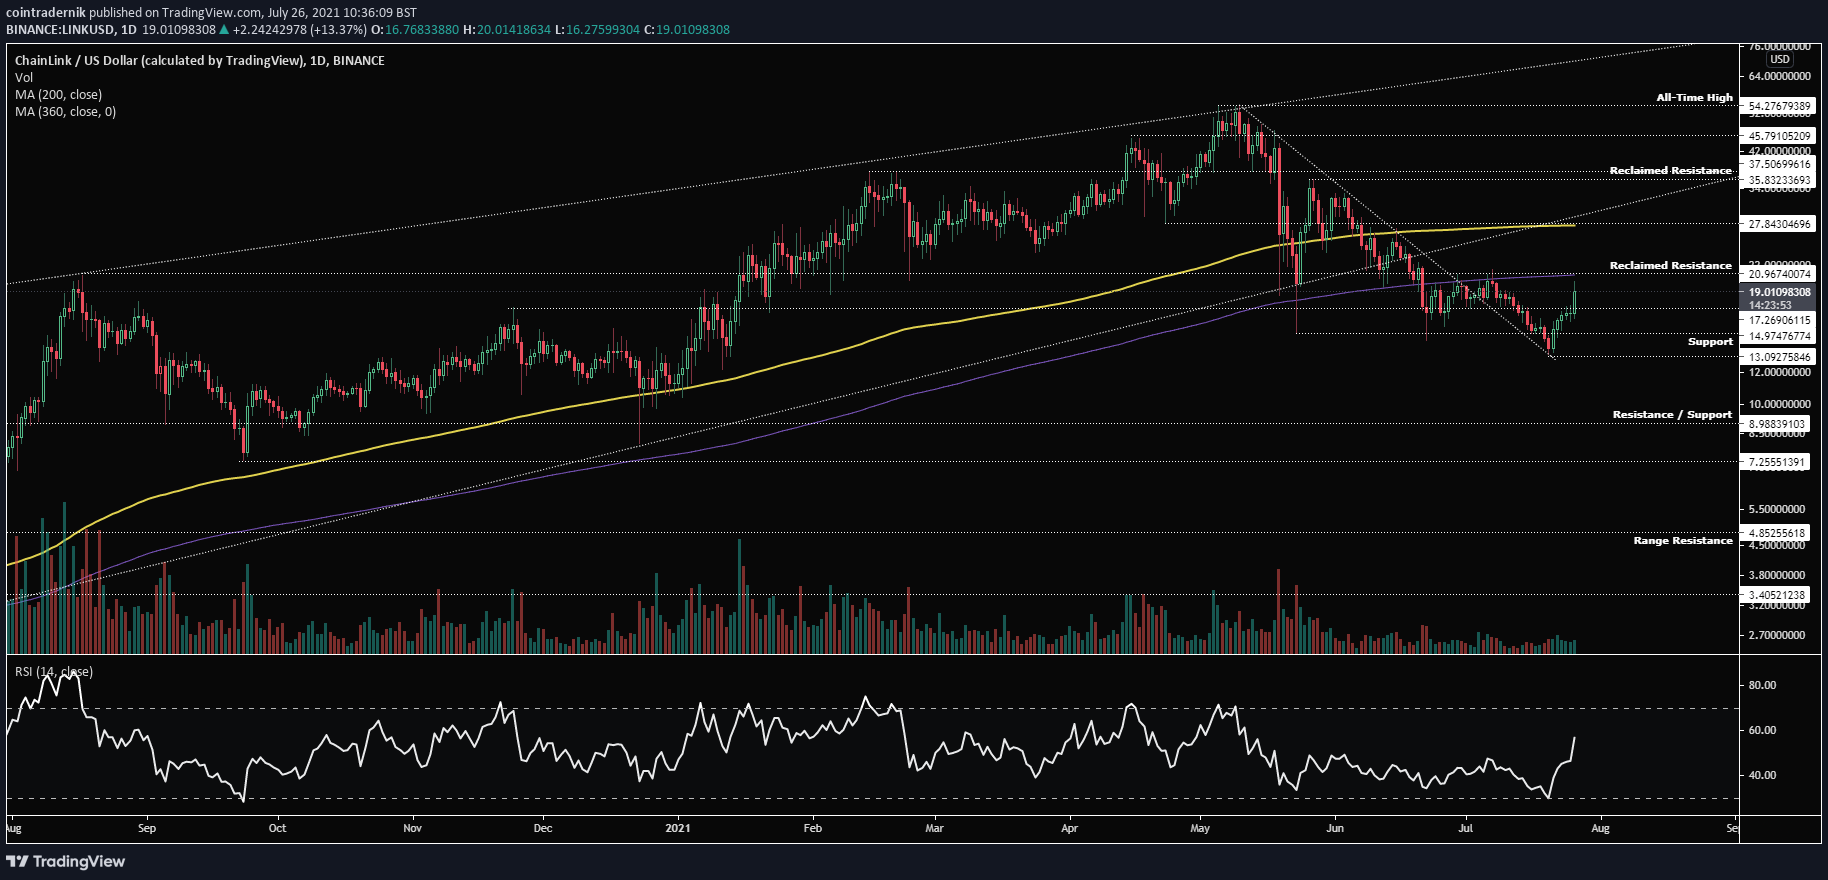
Price: $19.07 (49,820 satoshis)
Market Cap: $8.404bn
Thoughts: Beginning with LINK/USD, from the weekly we can see a similar pattern to that of LTC/USD, whereby price formed a low in May at $17.27 , swing-failed that low and then last week printed another swing-failure of the previous low, dipping into $14.97 before closing back above $17.27. Price is now pushing up against the August 2020 reclaimed resistance at $20.97, which is a critical level to overcome. If we do see a sustained push, bulls would need to see a weekly close above $21 to provide the impetus for a deeper squeeze to $27.85 – the origin of the breakdown. That would be where longs should consider trimming or at the very least hedging, with further upside expected on a weekly reclaim of that level, where the next resistance would be at $36. Dropping into the daily, price is now retesting not only reclaimed resistance but the 360dMA; if we get a daily close above both, I will look to buy an intraday dip for the next leg higher into the 200dMA at $27.85. If, however, we swing fail $21, I’d be looking to short it back into $17.27 – the next support level below.
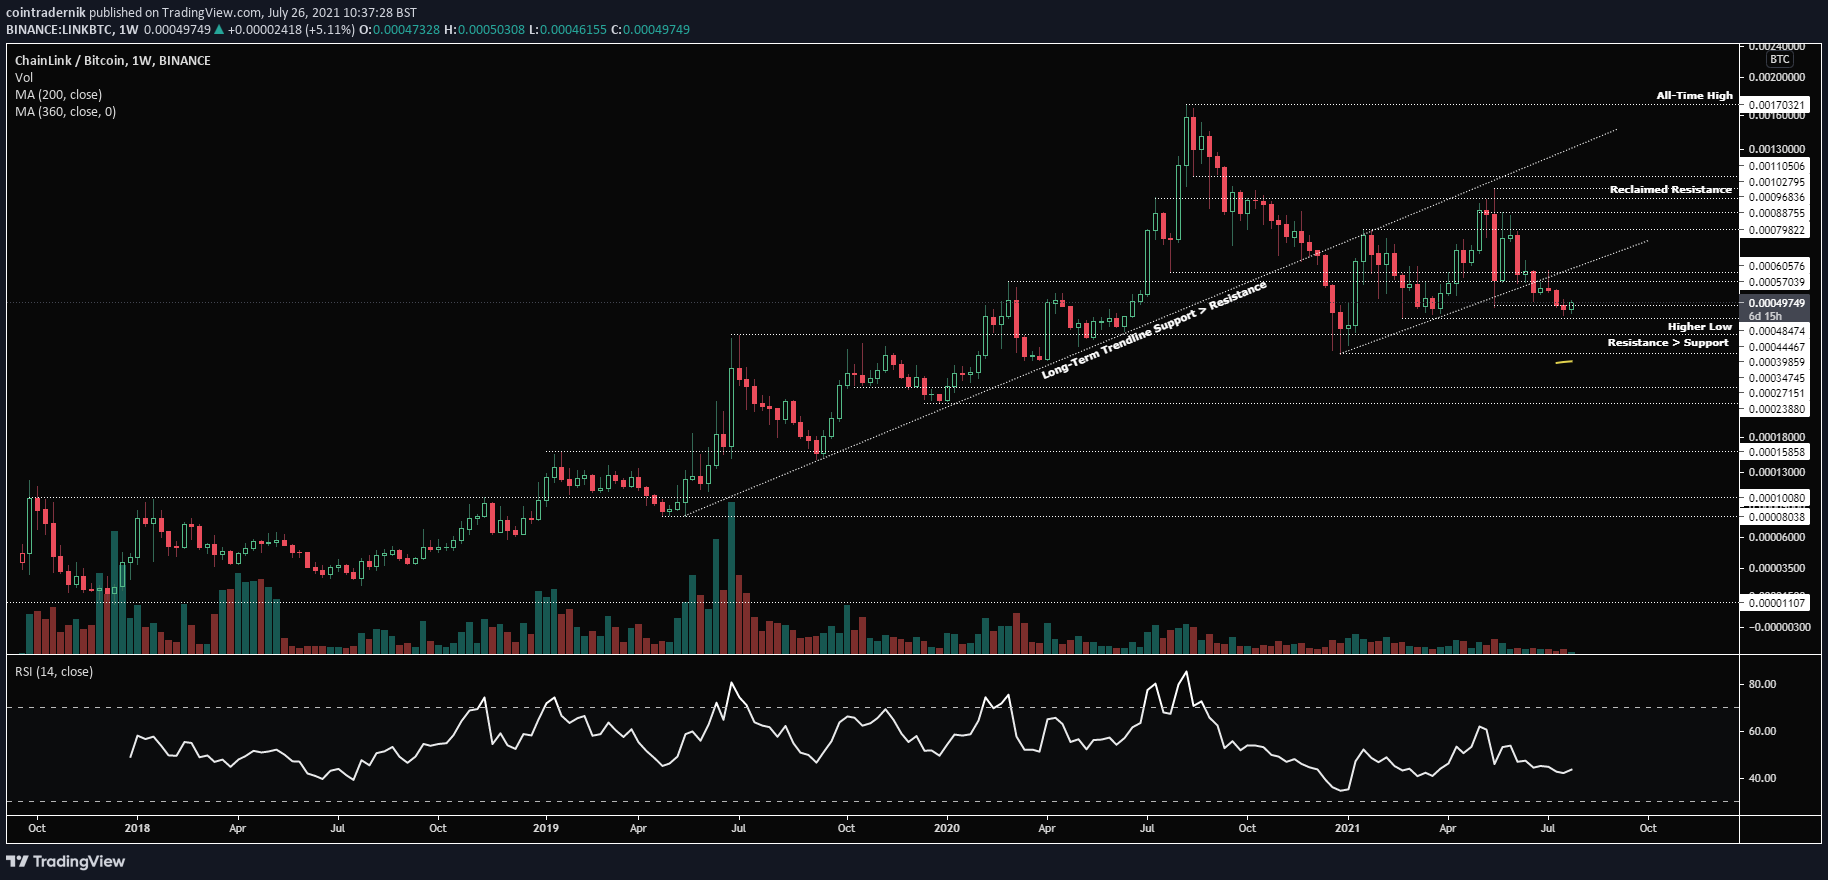
Turning to LINK/BTC, from the weekly, we can see that price is potentially making a macro higher-low, despite having broken down from local trendline support. If the pair can hold above 44.5k satoshis, the structure here remains relatively bullish. I would, however, prefer to wait for price to reclaim the cluster of resistance between 57-60.6k satoshis before jumping into any longer-term spot position, but if we do see that unfold, I would expect price to push back towards resistance above 90k satoshis. If, however, the confluence of resistance below 60.6k satoshis holds firm, I would expect to see the current structure lost on the next push lower, with 34.7k satoshis the final line in the sand before another round of capitulation.
Solana:
SOL/USD
Weekly:

Daily:

SOL/BTC
Weekly:

Daily:

Price: $29.74 (77,667 satoshis)
Market Cap: $8.094bn
Thoughts: I’ve included the weekly charts for SOL here for reference, but it is the daily that I am most interested in.
If we look firstly at SOL/USD, on the daily we can see that the pair has struggled to close below support at $24.60 and has been wicking below that level into resistance turned support at $18.73 but immediately being bought back. Price last week dipped below support at $24.60 into the 200dMA and has bounced once again, but what we also seem to be seeing is weaker bounces every time, with price making consecutive lower-highs. I am now looking at the high at $38.42 as the key level for SOL; if we can keep squeezing higher and break the trend of lower-highs, it might well be time to ride this to new all-time highs. If, however, price forms another lower high below $38.42 and begins breaking down, it is likely we are headed back to the 200dMA. Until we get a breakdown below $24.63 and the 200dMA, I am uninterested in any SOL shorts, but if that does occur, I will be looking for a return to $11.80 as a first target.
Turning to SOL/BTC, again, there is the possibility that this range above 71.7k satoshis is distributive, and we will know that if we see a breakdown below that level, but for now price is simply range-bound and making lower highs. I am expecting this level to hold for now, with any push towards 100k satoshis and opportunity to look for shorts (would be synthetic – BTC/USD long, SOL/USD short etc.) back towards 71.8k satoshis. My stop there would be the swing-high at 111k satoshis, which, if broken and closed above, would shift the momentum in favour of trend continuation back to the all-time high at 137k satoshis.
Monero:
XMR/USD
Weekly:

Daily:

XMR/BTC
Weekly:

Daily:

Price: $230.36 (0.00602 BTC)
Market Cap: $4.135bn
Thoughts: Beginning with XMR/USD, there is plenty of symmetry here with LTC/USD following the breakdown from the parabolic curve, with price having formed support at prior resistance at $187, albeit without the three drives lower. Instead, Monero has been holding very steady at $186, with price for the past month trapped between there and resistance at $215. Following last week’s bullish hammer, price has pushed beyond $215 today, and if we can hold above that level, I’d be looking for continuation towards the lower-high that formed at $315. Until we get a weekly close above that lower-high, thus turning market structure bullish on the weekly, I am assuming we will see rejection either below that level or on a sweep of that level, where I would look to short the pair back towards $186. If bulls have more control and do flip $315, I’d look to buy any pullbacks into $287 to ride higher into $380 – the capitulation candle high. Looking at the daily, we are on the verge of closing above minor resistance at $228, which would push the pair higher into the 200dMA; close above that and I think we’re on for at least a $287 retest, if not a sweep of the high above at $315. In that range between the two levels, I will be looking for signs of exhaustion and for derivatives premiums to begin considering shorts. If, however, the pair rejects at or below the 200dMA, I will sit on the sidelines until $186 is lost.
Turning to XMR/BTC, the picture is the same as it has been for a couple of months and the pair is resting on long-term reclaimed support at 0.006, which I would like to see hold. If we lose this level, I’d expect to see a move lower into the prior range high at 0.005 and potentially lower. In fact, this is a high R spot for a buy, as we can sell a weekly close below 0.006 but we would be looking for at least a trendline retest if not 0.0085. If we do catch a bid here, that is where I’d hedge the spot buys and un-hedge on a clean break above the trendline and above 0.0085.
THORChain:
RUNE/USD
Weekly:

Daily:

RUNE/BTC
Weekly:

Daily:

Price: $4.27 (11,180 satoshis)
Market Cap: $999.462mn
Thoughts: Beginning with RUNE/USD, from the weekly we can see that price has underperformed significantly over the past couple of weeks in particular, in light of the various fundamental issues that were brought to the fore. In fact, into the low last week at $2.98, price had lost 86.6% of its value from the all-time high a couple of months ago. That said, price has bounced sharply from that support, rallying into prior support turned resistance and trendline resistance at $4.37. This would be an ideal place to cover partial longs if you took them during the events of last week, or potentially to open up shorts if we see signs of rejection and breakdown here. If we do not, I’d expect a trendline breakout to follow, with the momentum taking price into the next cluster of resistance between $6 and $7.19, which is where I would expect sellers to begin stepping in. If, however, sellers step in here, then I’d be looking for that $2.98 bottom to get taken out, with any close below there opening up the likelihood of significant decline towards $1.22 – the next major support.
Looking at RUNE/BTC, we can see that price has now reaching the August 2020 resistance turned support at 10.3k satoshis, but I am yet unconvinced of a bottom for the pair, with no real wick into support nor a range having formed. If anything, this looks like an area for brief relief back into resistance at 12.8k satoshis, followed by another leg lower towards stronger support at 6.2-6.6k satoshis. If we do get down there, I’d be looking for either a strong wick below the level to be bought up, or for a tight range to begin forming down there. If we look at a classic altcoin cycle, does this look like depression yet?
Fantom:
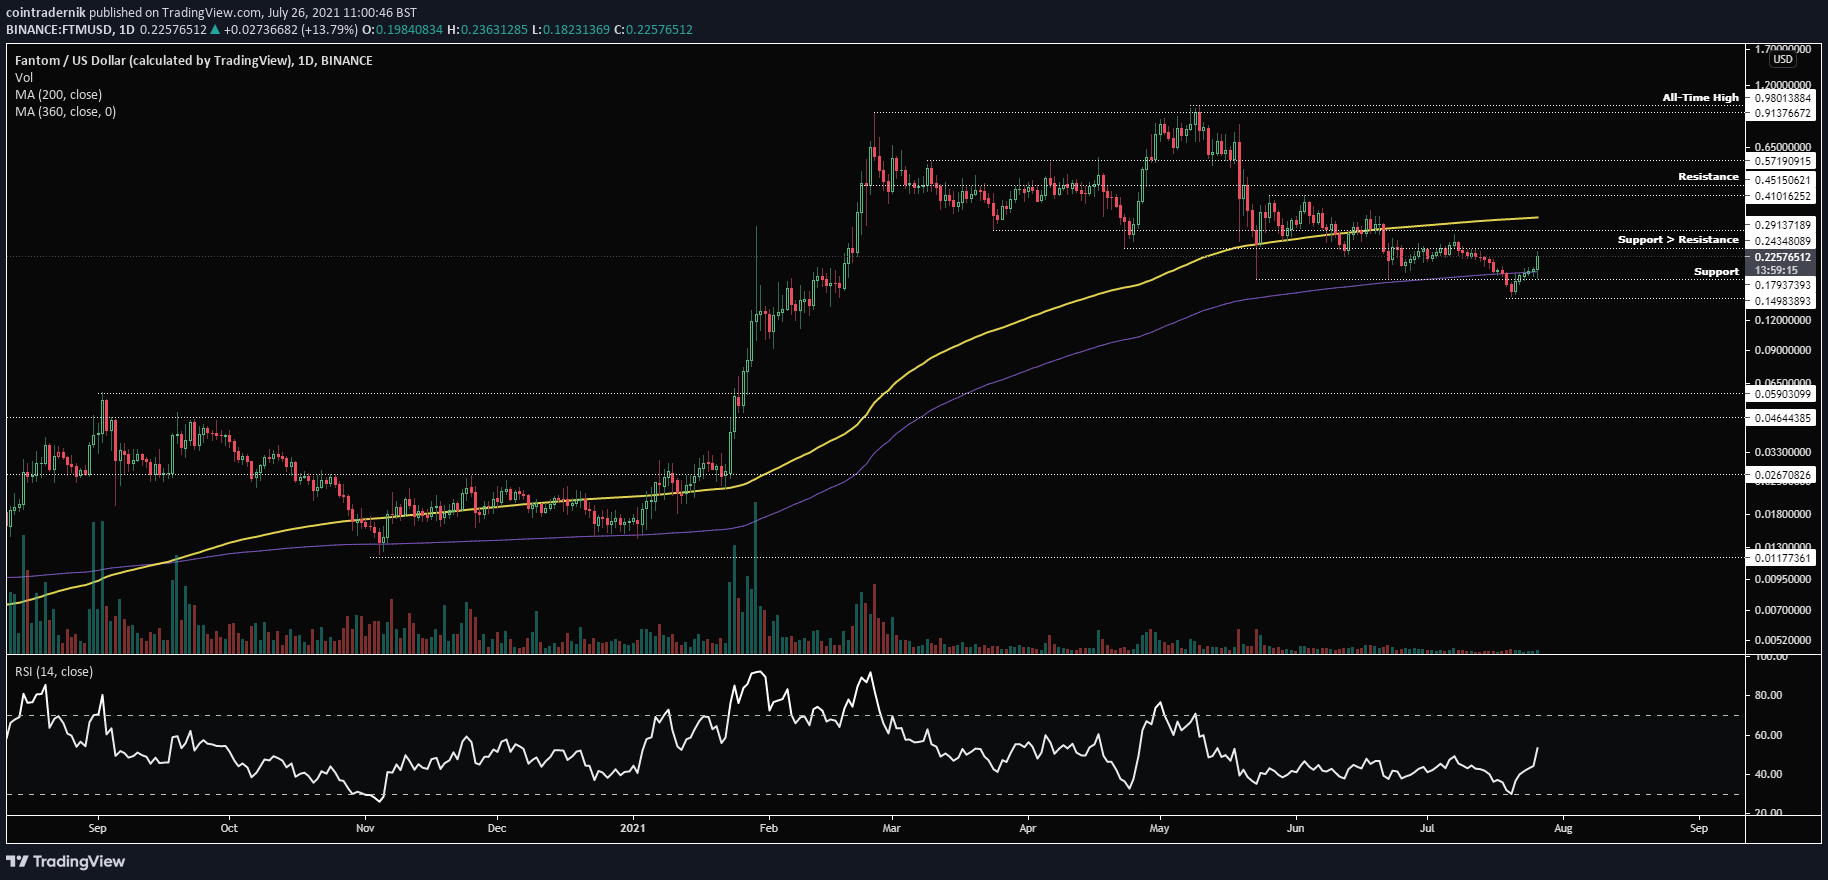
FTM/USD
Weekly:

Daily:
FTM/BTC
Weekly:

Daily:

Price: $0.22 (584 satoshis)
Market Cap: $564.420mn
Thoughts: If we begin by looking at FTM/USD, we can see that price had formed a double bottom at $0.18, which was wicked straight through last week into $0.15, before price closed the week back above support. This is a similar pattern to pretty much everything across the board at the moment, as we have seen, and we are now approaching the first level of support turned resistance at $0.24, which I would like to see price close above to show me that bulls are taking the reins here. If we do see that, the next level above is actually where price broke down originally at $0.29, so I would expect to see sellers step in there. In the event that they do not, that is where I see a possibility for a significant relief bounce perhaps as high as $0.57, which is the high that preceded the all-time high and thus would be expected to provide serious resistance. Assuming we do see a weekly close above $0.29, a subsequent dip would be the opportunity I’d be looking for to hold it for at least 40% into $0.41, if not 100% into that $0.57 area. Looking below, however, we have literally no major support below last week’s low all the way into at least trendline support if not the August 2020 high at $0.059 – if we see rejection below $0.29, I’d be looking for shorts to hold for several weeks, covering at $0.15 but reopening should we get a weekly close below that level. However, if we quickly look at the daily chart, one key indicator here for the likelihood of more sustained relief before any further downside is the fact that we bear-trapped the 360dMA and reversed sharply, indicating that the pair is not yet ready for a breakdown and thus end of the long-term trend; when that 360dMA really is lost, I think we see that $0.05 area retested.
Turning finally to FTM/BTC, unlike RUNE/BTC, this pair is approaching an important historical pivot, where price had found resistance between 440-570 satoshis for the entirety of its history until March 2021. The pair subsequently rallied to 1877 satoshis and has since returned to the 570-satoshis area, which is holding as support at present. If we start to see a range form here, I would be interested in accumulating spot; if the 440 area is closed below on the weekly, I am afraid we are looking at a return to historical support at 90 satoshis, where I’d expect a new long-term range to form.
And that concludes this week’s Market Outlook.
I hope you’ve found value in the read and thank you for supporting my work!
As ever, feel free to leave any comments or questions below, or email me directly at nik@altcointradershandbook.com.


