
Market Outlook #133 (13th July 2021)
Hello, and welcome to the 133rd instalment of my Market Outlook.
In this week’s Altcoin Special, I will be covering Ankr, Band Protocol, Constellation, COTI, DIA, Kylin, Ferrum Network, Decentr and Geeq.
Ankr:
ANKR/USD
Weekly:

Daily:

ANKR/BTC
Weekly:

Daily:

Price: $0.069 (209 satoshis)
Market Cap: $485.522mn
Thoughts: If we begin by looking at ANKR/USD, we can see from the weekly that price took out the May low at $0.065 into resistance turned support just above $0.042 a couple of weeks ago and has since been consolidating between $0.065 and resistance at $0.09. Volume has all but disappeared following the all-time high back in April and weekly RSI has returned to similar levels experienced during the Q4 2020 consolidation. Whilst the pair is capped by reclaimed resistance at $0.091, I think it is likely we continue to see the pair chop around inside its current range, particularly in the context of the buying pressure that appeared on the sweep of the May low. Dropping into the daily, we can see that that sell-off below the May low took price towards the 360dMA, above which it bounced sharply, with the 200dMA now acting as resistance despite having acted as support the entire bull market. Now, back in Q4 2020, there was a brief period where price battled with the 200dMA, and so if we see buyers step in here and a daily close back above the cluster of resistances at $0.091, I think there would be an argument to be made for trend continuation, or at least extended relief. However, whilst the pair is below that level, I am uninterested. The bearish scenario here would be to break back below $0.065 and retest the 360dMA and prior resistance, as a loss of $0.041 would confirm an extended bear market, with the next support below that at $0.019.
Turning to ANKR/BTC, looking at the weekly we can see the pair found support at prior resistance (the August 2020 high) ~156 satoshis, with the pair now just about holding above the May low at 209 satoshis. Price has found serious resistance at 300 satoshis for the past few months, with several consecutive weekly closes below the level. Whilst ANKR is trapped between these two levels, there is not a great deal of interest here. I would like to be a buyer on a weekly close above 300 or much much lower if that 156 satoshi level is lost, ideally back at the original accumulation area ~32 satoshis, although that could be several months away at this point.
Band Protocol:
BAND/USD
Weekly:

Daily:
BAND/BTC
Weekly:

Daily:

Price: $6.82 (20,580 satoshis)
Market Cap: $240.16mn
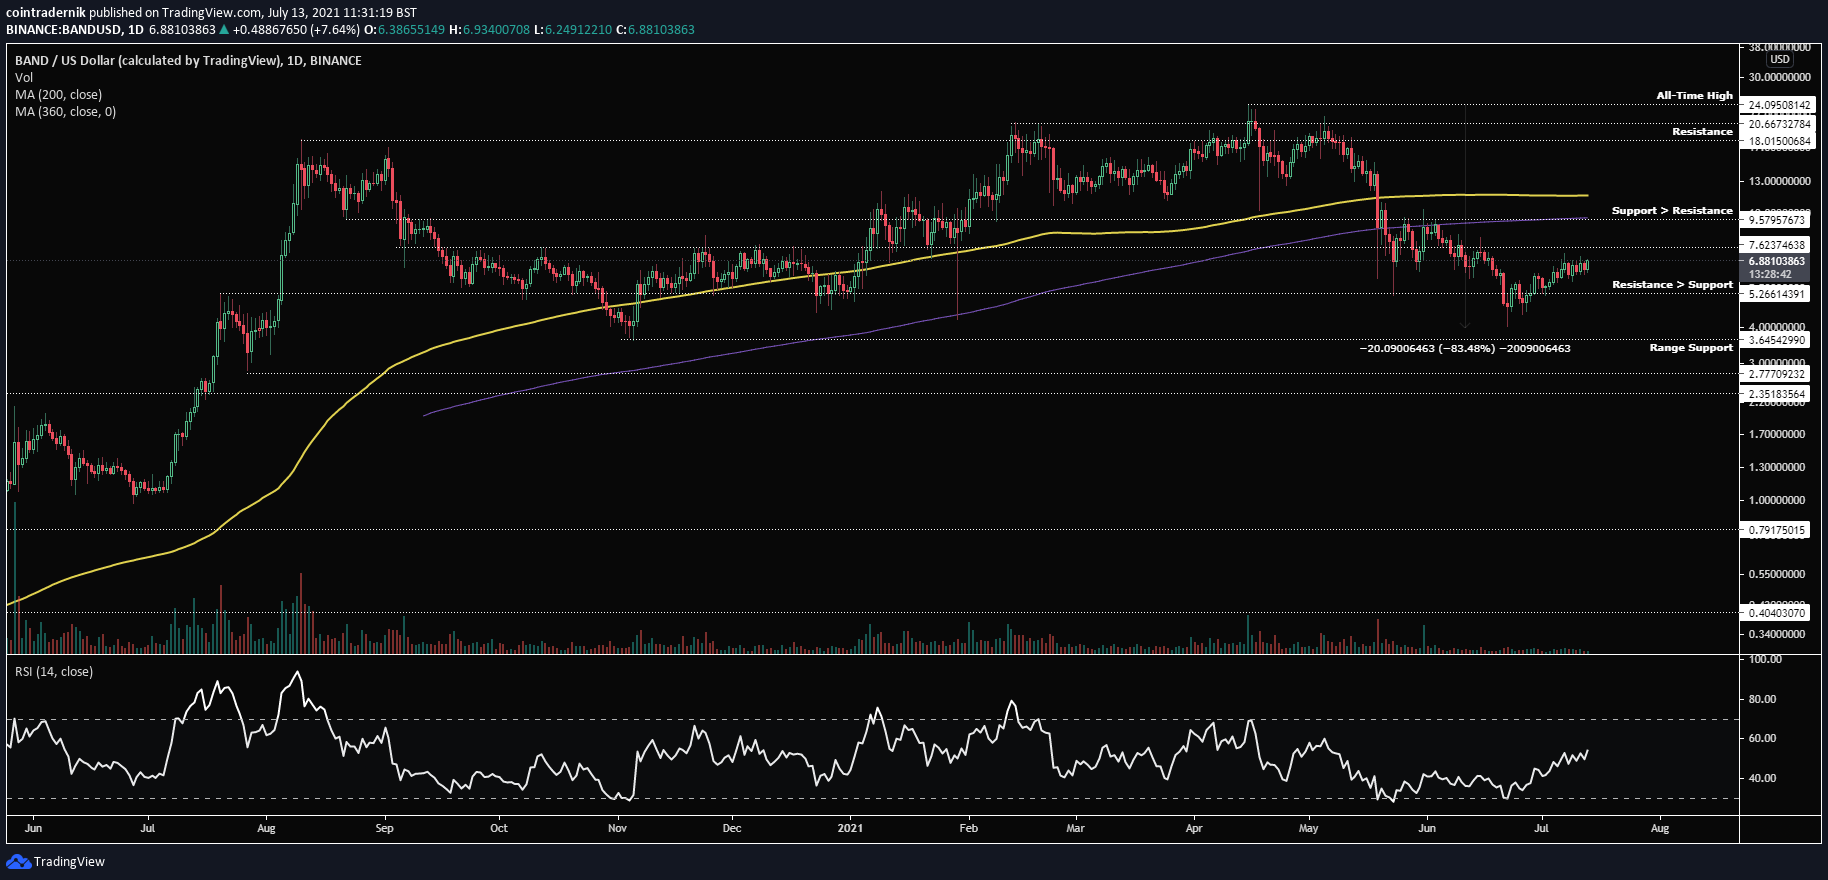
Thoughts: Beginning with BAND/USD, we can see from the weekly that the pair has been chopping in a long-term range between support at $3.65 and resistance around $18 since August 2020, with that range support failing to give way on a retest a couple of weeks ago. Whilst BAND is inside this (albeit large) range, I think the play is to keep buying support between $3.65 and $5.26 and holding to sell the top of the range at $18. For those looking for a shorter-term trade, I would wait for the mid-range around $9.58 to be flipped as support and then play that back to the top of the range. If BAND fails at the mid-range, it is likely we see the bottom of the range retested, with any weekly close below $3.65 spelling long-term disaster, as I would consider that the beginning of a much larger retrace, potentially as far as the original accumulation range at $0.40.
Turning to BAND/BTC, we can see on the weekly that the pair is in the midst of a textbook market cycle, having formed euphoria back in August 2020 at 150k satoshis and having since bled out slowly, now looking as though it is in the latter stages of that market cycle, possible approaching depression. Prior resistance has become support around 15k satoshis and if this is to become the bottoming structure for the next cycle, it is imperative that range support holds. As such, buying as close to 15-17k satoshis provides tight invalidation for a long-term spot position, with any weekly close below the June low opening up much more downside, potentially as far as the 5300-satoshi area, where I would certainly look to be a buyer for the long term. Dropping into the daily, we can see that the pair has lost over 90% of its value from the all-time high, which is a good sign for a potential bottom. As I said, if you want to be a buyer here based on the premise that this is depression – at least for the BTC pair – then your stop is potentially 25% lower, with a long-term target of the all-time high but certainly a first target of the resistance cluster at 40k satoshis. I am personally going to sit this one out and see if that June low falls, as I would love to be a buyer down at 5300 in a few months time.
Constellation:
DAG/USD
Weekly:

Daily:

DAG/BTC
Weekly:
Daily:

Price: $0.173 (521 satoshis)
Market Cap: $218.729mn
Thoughts: Constellation has outperformed pretty much everything during these past few weeks, and from the weekly chart for DAG/USD we can see that price bottomed around prior resistance ~$0.026 and reversed all the way to new all-time highs above $0.095 a couple of weeks ago, trading on all-time high weekly volume on the breakout last week. The pair has now formed a new all-time high at $0.23 and I now own zero DAG. In fact, I sold (as mentioned in previous outlooks) on the retest of the $0.05 area, then rebought when $0.07 was reclaimed and then exited pretty much everything at the 1.618 extension ~$0.138, as can be seen on the daily. I retained a small percentage which has now also been sold. That said, looking at the chart, there is a chance this continues higher, but in these market conditions I am very happy with my exit price. If you are still holding DAG, the next area of interest above is $0.27, which is the 3.618 extension of the April-May range.
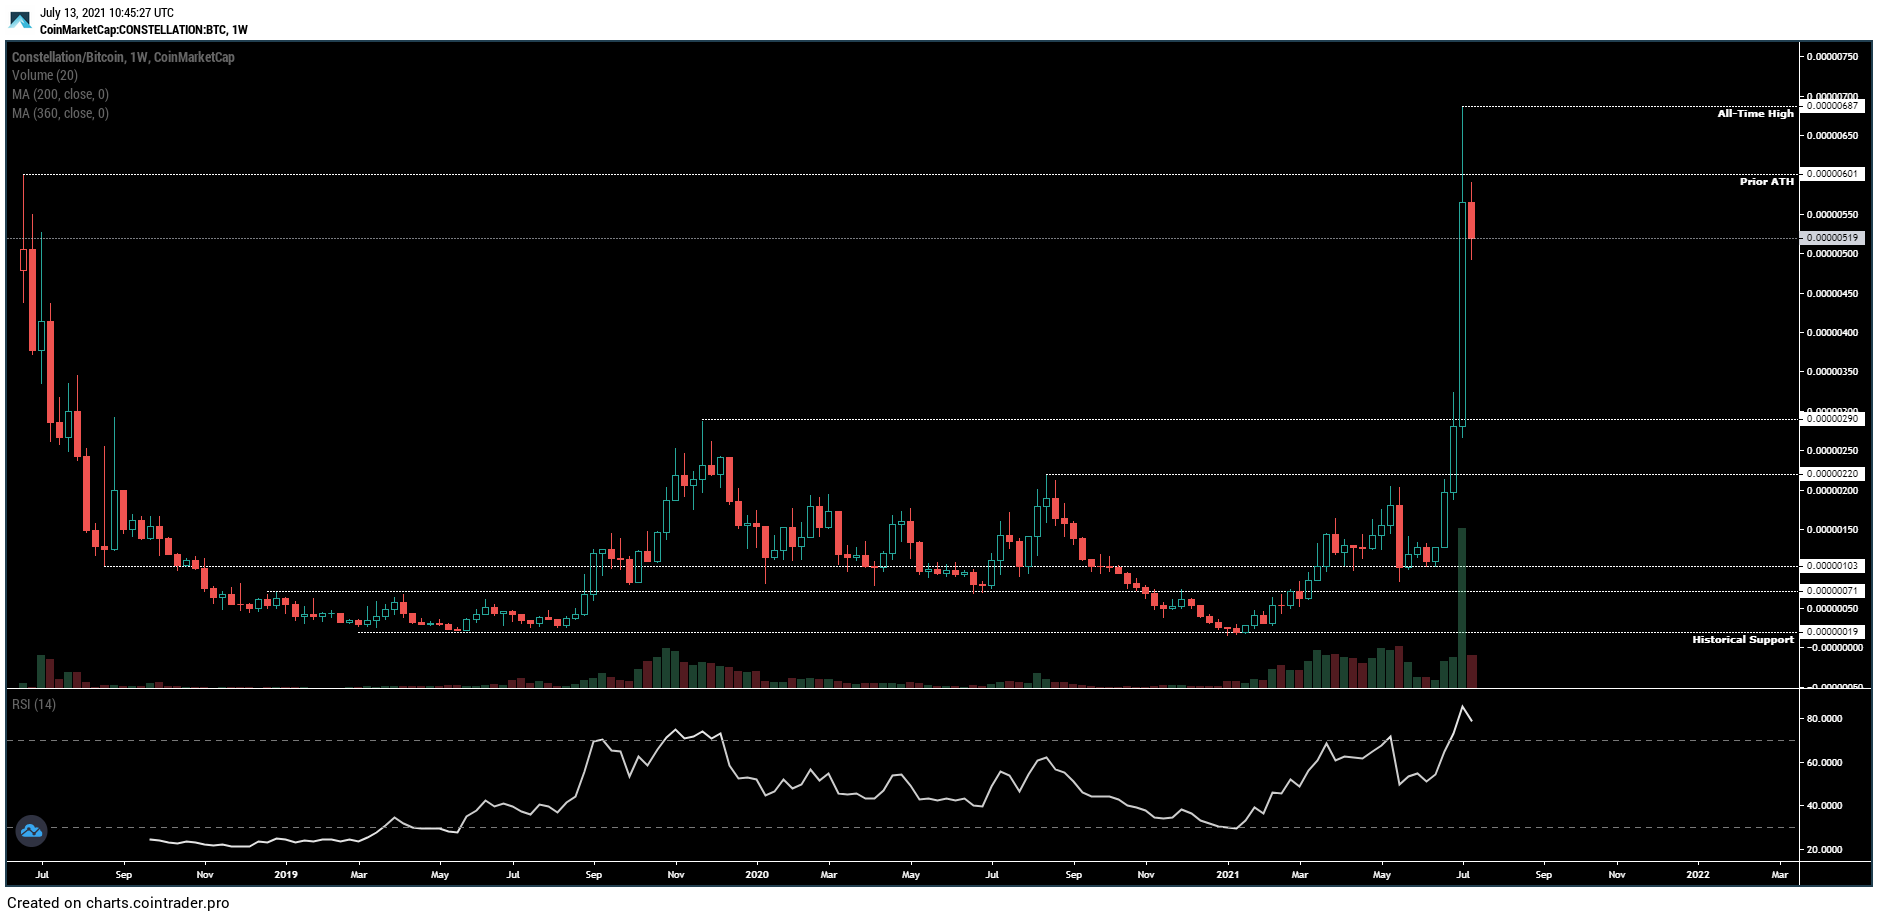
Looking at DAG/BTC, here we can see the primary reasoning behind my total exit – the pair has now made a new all-time high against BTC above the 600-satoshi high from inception, which was my final target from my original buys around 25 satoshis. Given the weekly swing-failure of that high at 600, I see no reason to remain involved. Further, since the January low at 19 satoshis the pair has now rallied 35x against BTC, which is significant. Looking at that weekly, I am reminded of ANKR/BTC – go back and look at the weekly chart from above for that pair and understand that despite the perceived strength of that weekly candle, the pair has simply consolidated well below resistance now for months. This has been a great ride but I look forward to rebuying DAG in potentially 6-12 months time back below the 360-day moving average, which is currently sat at 100 satoshis.
COTI:
COTI/USD
Weekly:

Daily:

COTI/BTC
Weekly:

Daily:
Price: $0.127 (383 satoshis)
Market Cap: $85.071mn
Thoughts: Beginning with COTI/USD, we can see from the weekly that the pair is consolidating around prior resistance turned support at $0.135, with the pair having put in a low at $0.11, just above prior range resistance at $0.099. Whilst COTI continues to consolidate in this area, it is possible that a bottom is forming; however, lose that $0.099 level on the weekly and I would expect to see another 50% or greater retrace, back towards the March 2020 high at $0.04. Hold here and begin to form a tight range and I would look to rebuy my COTI for another leg higher beyond the all-time high later this year. Looking at the daily, the pair has lost the 360dMA, which isn’t promising for holders, but if it can begin to form a range above that $0.10 level I think there is a possibility a bottom could be forming. As such, if it continues to hold for another couple of weeks, I would look to be a buyer with a tight stop on a close below that level.
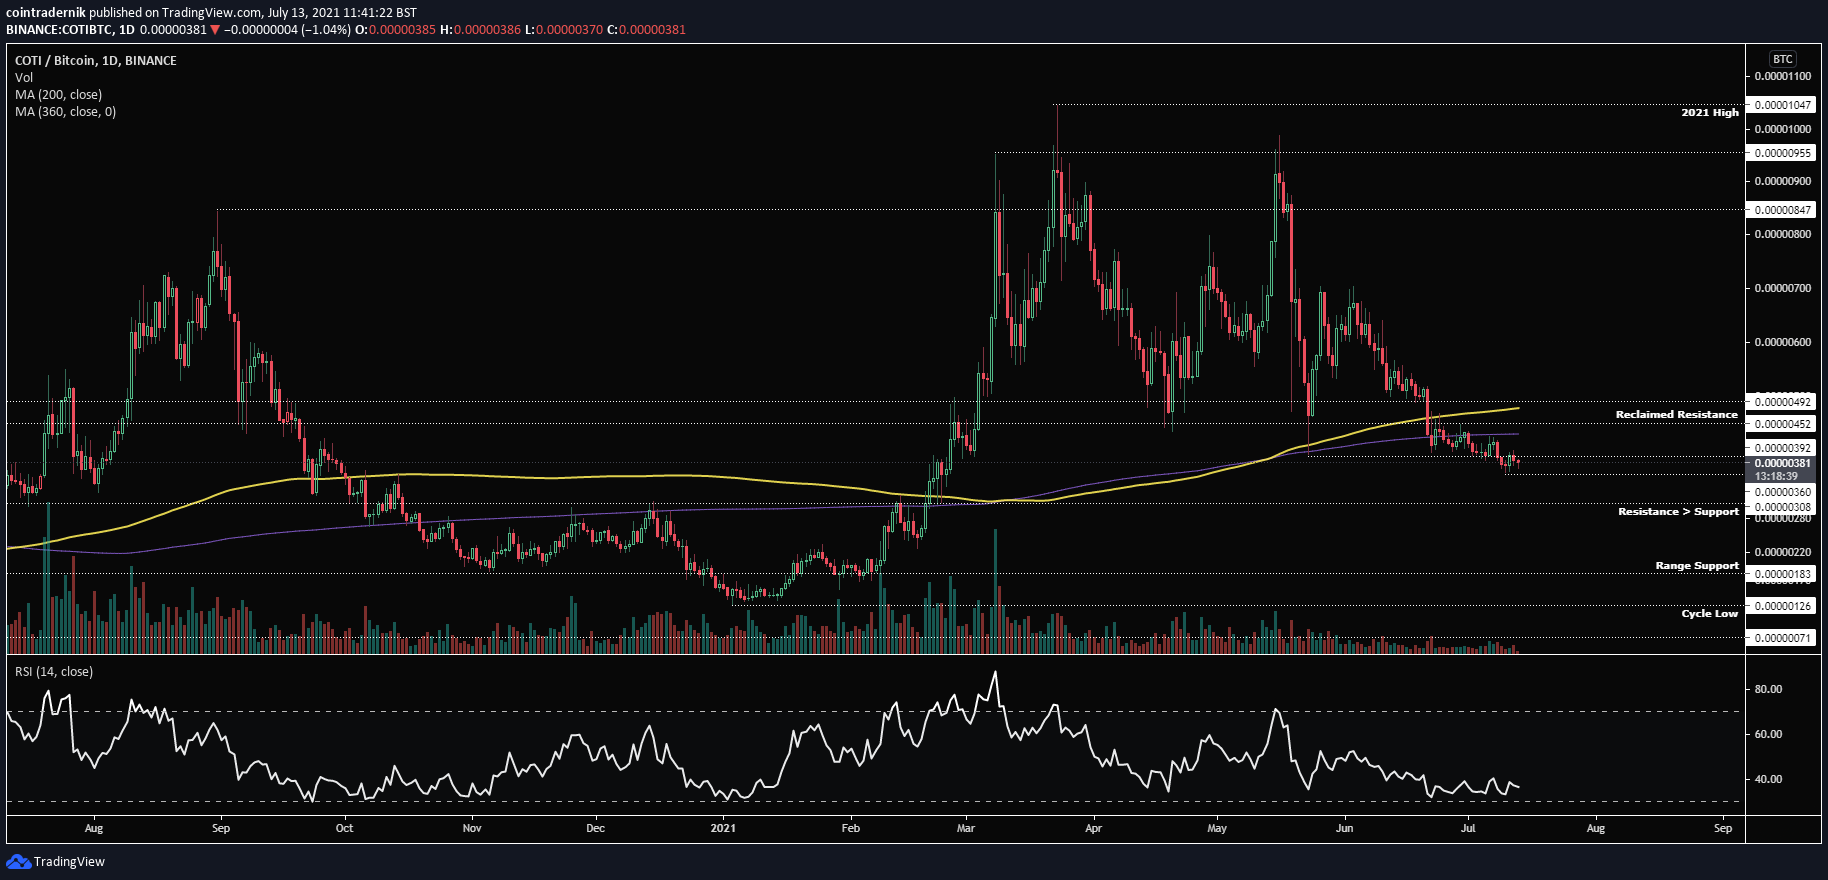
Turning to COTI/BTC, we can see the pair is in no man’s land, having found significant resistance above 850 satoshis and now trading well above the original accumulation area. Whilst the pair is above 310 satoshis I don’t think there is a trade here, and more recently the pair lost the pivot around 450 satoshis, which indicates to me that we may see further bleeding down towards that 310-satoshi area, which is the next major support. Close the weekly below that and I would expect to see the original range support at 180 satoshis be retested, which would be my area to begin dollar-cost-averaging back into a long-term position. If 310 holds, however, I’d look to rebuy on a weekly close back above 492, then looking to play that into 850 satoshis.
DIA:
DIA/USD
Daily:

DIA/BTC
Daily:

Price: $1.50 (4533 satoshis)
Market Cap: $62.274mn
Thoughts: If we look firstly at DIA/USD, we can see that the pair has very clear historical support and resistance, having played out the best part of two market cycles with resistance being found at $6.18 and support being found at $0.91. A couple of weeks ago the pair bounced off that support zone and is now coming into resistance around $1.79. I would like to see a similar bottom formation to that of Q4 2020 before I enter a position here, but if we do return to $1.14 and hold that area as support I would look to scale in, buying incrementally over a couple of weeks. My stop loss will be the all-time low, as any move below that opens up bearish price discovery and invalidated the historical accumulation zone.
Turning to DIA/BTC, again the pair has just bounced off the all-time low and historical support zone at 323 satoshis, which is a vital level to now hold. We have just reclaimed prior support at 400 satoshis, so again I would like to be a buyer on any dip back into that range, with a hard stop on a loss of 323. If the current all-time low does hold, there is a high probability that this is the accumulation range, which we can verify at a later date by looking on-chain at the rich list. I would expect to see resistance hold at 700 satoshis for several more months potentially if this is the long-term accumulation range for the next cycle, so we should have plenty of time. This is one of the few charts that on both USD and BTC pairs is beginning to look promising for a long-term entry.
Kylin:
KYL/USD
Daily:

KYL/BTC
Daily:

Price: $0.13 (395 satoshis)
Market Cap: $17.824mn
Thoughts: Kylin was a much-hyped presale that launched at precisely the wrong time, and this is exactly the sort of project I will be looking at over the coming months for a potential long-term position, as it had no real bull cycle and has just continued to bleed since launch. Looking at KYL/USD, we can see that price did pull a 3.5x from support at $0.60 into an all-time high at $2.21 in late March, but price has since bled through that support and continued to break new all-time lows each week, flipping support as resistance. We are now 94% off the all-time high but the pair has shown no signs of slowing down as of yet. What I am looking for here is for a tight flat range to form after the pair has lost 95% or more of its value from the all-time high. If we start to see a range form down at $0.10, that would interest me for a long-term position. Certainly one to keep an eye on over the coming weeks and I will be providing more of these in future outlooks.
Turning to KYL/BTC, the picture is much the same, with price having pulled a 3x from support at 1240 satoshis into an all-time high at 3630 and then just bled out for months, losing 1240 in early May and continuing to bleed to new all-time lows pretty much every day since, with the current low at 380 satoshis. The pair has lost around 90% of its value from the all-time high during that period and again does not look to have formed a bottom yet. Whilst it continues to flip support into new resistance and push lower, I am not interested, but as soon as a range begins to form, I will begin monitoring the rich-list for signs that large holders are buying and begin scaling in. This is the epitome of buying retail pain, as those that bought after the presale and have held will be sitting on significant drawdowns – buy their capitulation.
Ferrum Network:
FRM/USD
Weekly:
Daily:

FRM/BTC
Weekly:

Daily:

Price: $0.11 (325 satoshis)
Market Cap: $16.528mn
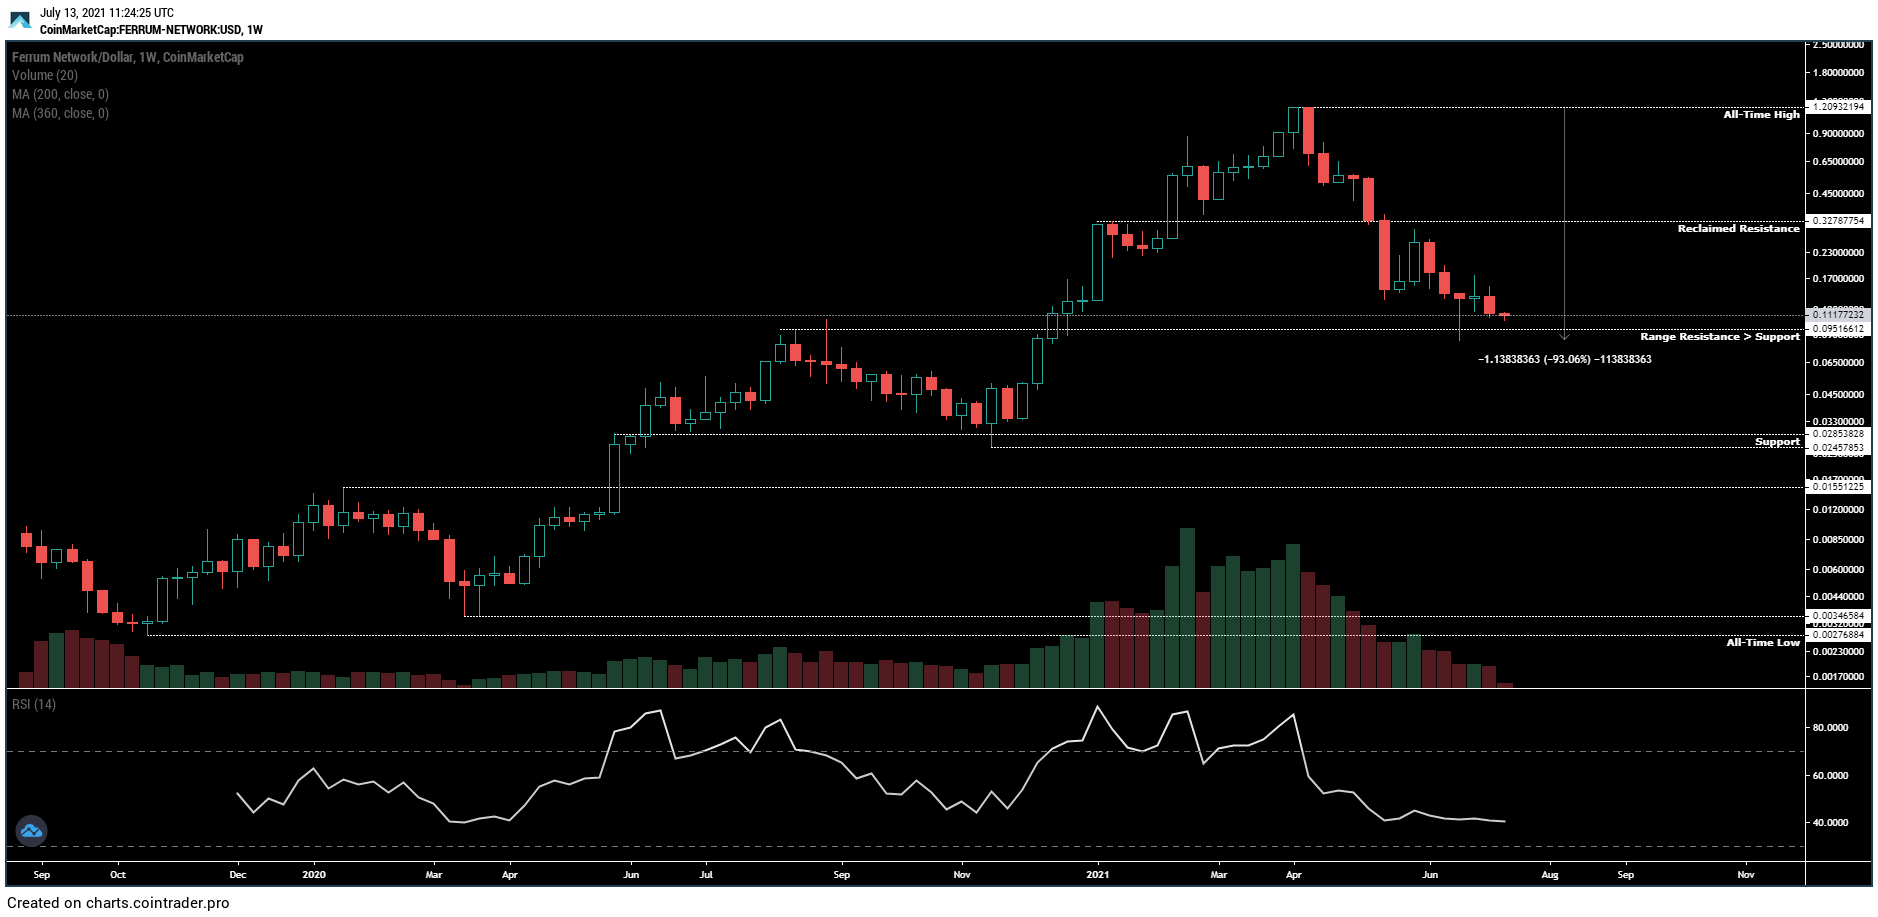
Thoughts: Looking at FRM/USD, we can see from the weekly that the pair is down around 93% from the all-time high but is now sat at prior range resistance turned support above $0.095. This is the perfect area to anticipate a bottom forming, but, as with other projects featured in this post, if we lost this pivotal level on the weekly, there is a high probability for another 50-75% retrace, with the next support here down at $0.029. As such, I will be looking for a flat base to begin forming above the prior range here before entering a new position, with a stop after entry on a weekly close below the June low. Looking at the daily, the pair is now well below the 360dMA but has just bounced above trendline resistance from the all-time high, which is promising for the formation of a potential bottom. As I said, I want to see a longer-term flat range forming above $0.095 to consider this a bottom, and if we lose that June low I think we see significantly lower prices in the coming months.
Turning to FRM/BTC, we find some degree of confluence here for a potential bottom, as the pair has returned towards the November 2020 bottom that preceded the bull cycle into new all-time highs at 2000 satoshis. That range support in November formed at prior resistance ~180 satoshis and so if the recent swing-low at 271 satoshis is lost, I think we retrace towards that level, which would be a great buying opportunity with a tight invalidation. Loss of the 180-satoshi level would open up the possibility of a full retrace towards the all-time low at 25 satoshis, so any buys at the level should have tight stop-losses to prevent potentially large drawdowns. However, we are still significantly above that level and it is possible the pair begins to form a macro bottom in the current area, as it did in November above the previous range high from January 2020. In that scenario, as can be seen more clearly on the daily, I would expect to see 270 hold as support and for price to become range-bound between there and 430-450 satoshis as resistance for several more weeks. If we begin to see that unfold, I will look at rebuying FRM.
Decentr:
DEC/USD
Daily:

DEC/BTC
Daily:

Price: $0.088 (266 satoshis)
Market Cap: $6.54mn
Thoughts: Beginning with DEC/USD, we can see here that the pair had lost 90% of its value from the all-time high at $0.61 on the June low at $0.058, but has since bounced and reclaimed prior resistance as support at $0.08. That said, there is nothing in the structure here that looks like a bottom just yet, and I would expect that June low to get taken out if we lose $0.08 here. Break back below that level and I could see DEC trading back towards the $0.044 area that became the mid-range for the Q4 2020 bottom, which is an area I would become interested in being a buyer at with a stop at new all-time lows. If that does not happen, I would be looking for a range to begin to form here above $0.08. This would make the June sweep of the level into $0.058 look like capitulation and that would make me more confident as a buyer that we are in the depression stage of the market cycle.
Turning to DEC/BTC, we can see that the pair has returned to the range that preceded the bull cycle of Q1 2021, with support being found at 180 satoshis. The 200dMA is now acting as resistance, with it having confluence with prior support turned resistance at 480 satoshis. If we see this 180 to 480 satoshis range continue to play out, I will begin looking for reasons to get involved as close to range support as possible, the primary of these being large holders buying inside the range. However, lose 180 and I would instead look to be a buyer on a sweep of the all-time low at 96 satoshis.
Geeq:
GEEQ/USD
Daily:

GEEQ/BTC
Daily:

Price: $0.50 (1509 satoshis)
Market Cap: $4.559mn
Thoughts: Again, GEEQ is one of those much-hyped projects that barely experienced a cycle in 2021, and thus is one that I would look to buy assuming the right market conditions.
Beginning with GEEQ/USD, the pair has lost 85% since the 2021 high at $2.80, retracing into prior resistance turned support at $0.40, which was the level that capped price prior to the Q1 2021 bull cycle. We have begun to form a flat range between that level as support and resistance at $0.65, which is promising, and if we see another couple of weeks of this range holding I will be looking at entering a position with a stop on a daily close below $0.39. If, however, that support falls before then, I would actually prefer to buy as close to the all-time low as possible at $0.25, as this was also the seed round price for investors. Ideally, I would like to see that all-time low taken out and reclaimed over the coming months for the most opportune long-term entry.
Turning to GEEQ/BTC, this is a beautiful chart for the speculator, as the pair barely ran from the all-time low at 1056 satoshis into the 2021 high in April at 4500 satoshis, before bleeding since then and continuing to be capped by the 200dMA as resistance. The pair is now trading back at range support, hovering above that all-time low, having lost over 97% of its value from the all-time high at 41.7k satoshis in August 2020. These are prime conditions for long-term entries, much like the Binance launchpad IEOS of Q2 2018. I would like to buy as close to that all-time low as possible if this range continues to hold, with a stop on a weekly close below it. If we do close below it, I would not rebuy until it was reclaimed or until we took out the $0.25 level on the dollar pair, as that is a critical level. Plenty to pay attention to here over the coming weeks…
And that concludes this week’s Market Outlook – Altcoin Special.
I hope you’ve found value in the read and thank you for supporting my work!
As ever, feel free to leave any comments or questions below, or email me directly at nik@altcointradershandbook.com.