
Market Outlook #122 (26th April 2021)
Hello, and welcome to the 122nd instalment of my Market Outlook.
In this week’s post, I will be covering Bitcoin, Ethereum, XRP, Cardano, NEO, Siacoin, COTI, VIDT Datalink, Ferrum Network and Cindicator.
As ever, if you have any suggestions for the next post, feel free to leave them in the comments below.
Bitcoin:
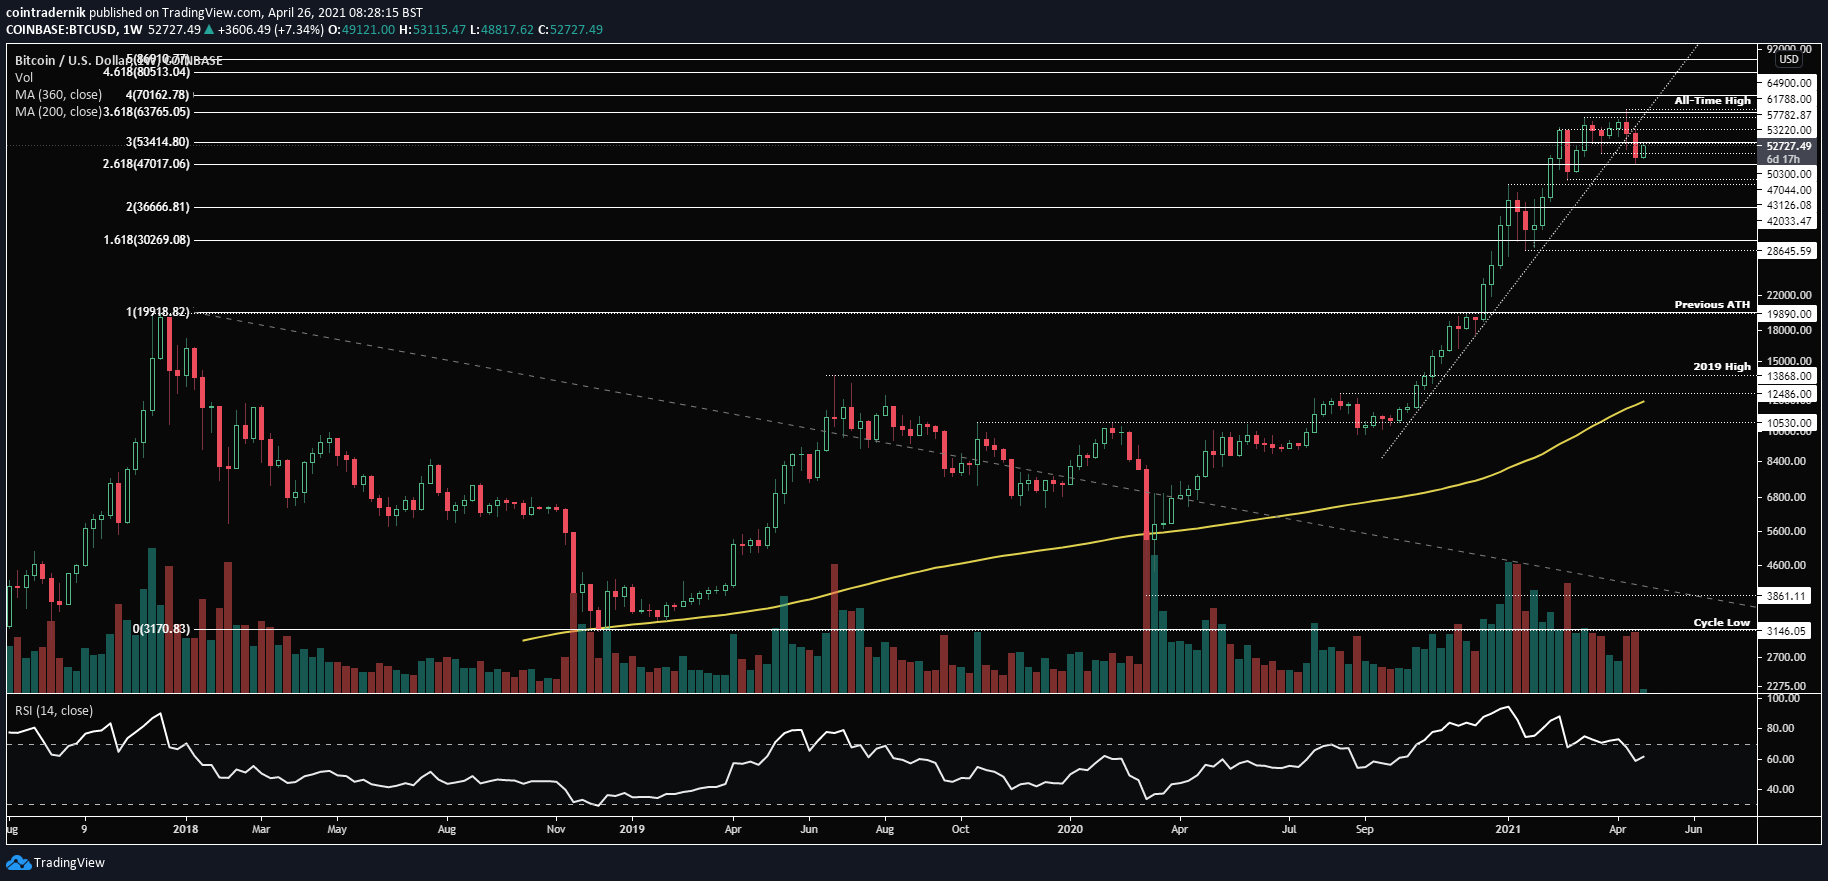
Weekly:
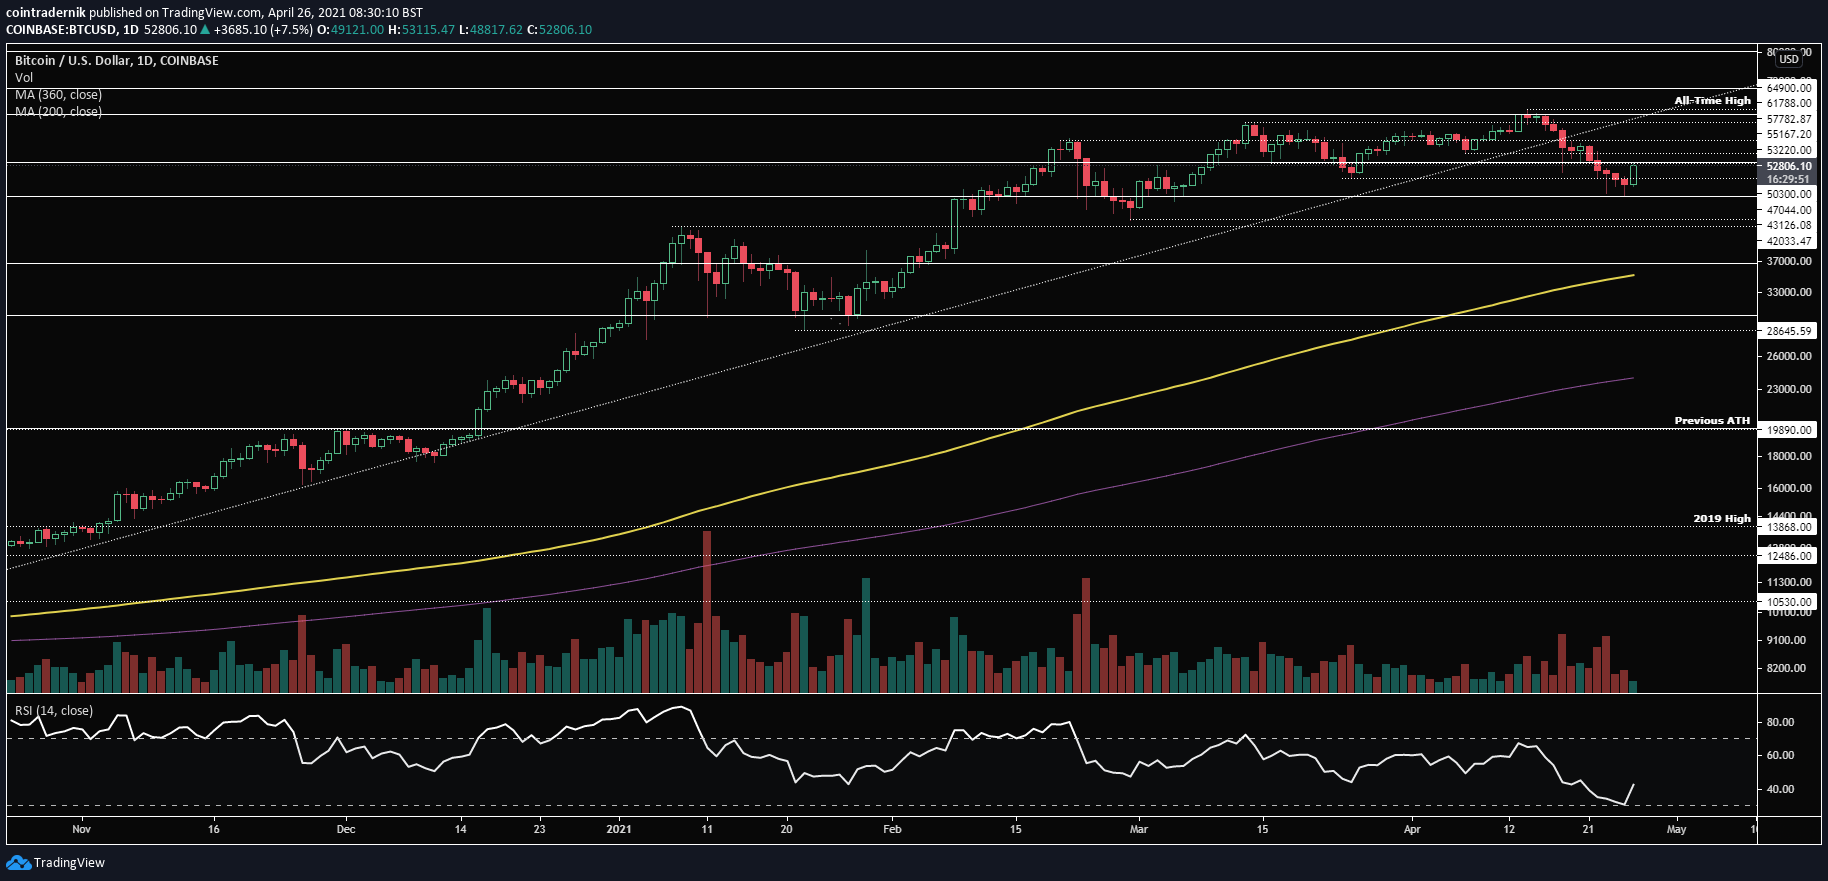
Daily:
4H:

Price: $52,727
Market Cap: $984.652bn
Thoughts: Well, what a week it has been for the space. I expected volatility and volatility is what we got in abundance.
If we begin by looking at the weekly chart for BTC/USD, we can see that the October 2020 uptrend has now comfortably been lost following last week’s close. As mentioned in last week’s post, the weekly swing-failure was a concern and I was either looking for strength early in the week suggestive of a bear trap or a flush of $50,300 to provide liquidity for a bottom to form. We began to sell off hard and fell straight through the previous weekly low around $51k before ultimate breaking below the $50,300 level, dipping into the mid-$47k area firstly and then into $47,044 last night before closing around $49.1k. This broke market structure by closing below that prior swing-low, but if we look at the lower time-frame charts, that low volume move from last night that facilitated the weekly close may well have been the bear trap.
Turning to the daily, we can more clearly see that last week printed that swing-failure of $55,200, but following a couple of days consolidation around the level, price fell through the $51k low and ultimately capitulated into ~$47,500 on Friday. However, that capitulation candle also printed a swing-failure of the $50,300 low; subsequently, Saturday was spent consolidating within Friday’s range on very low volume and Sunday saw Friday’s low swept into the weekly close, with $47,044 getting tagged and price reversing back towards $49,100. This double sweep into support looked rather bullish and today’s price-action appears to be confirming this, with a ~$4,000 bounce from the weekly close into $52,800 where it currently sits. Now, as long as that $47k low holds firm (i.e. no daily close below that level) the bottom is very likely to be in; close below it, and I will be setting bids around $42,900 to take advantage of everyone who will be stopped out if that $43,100 swing-low gets swept. Looking ahead, I’d like to see more volume come in early this week if this bounce is to hold, with a daily close above $53,200 opening up a move to retest prior support turned resistance around $55,100. If you missed my tweet this weekend, I mentioned that price-action over the past week was eerily familiar to that of late February, whereby we saw a perceived double bottom swept, and then that low get swept before a sharp reversal and trend continuation. If we can push on towards $55k from here and then put in a higher-low, I’d expect to see something similar unfold. However, given the loss of trendline support that has held firm since October, I am considering the likelihood of a more protracted range for BTC to be re-accumulated before another (and likely final) trend higher begins before the cycle peaks. I would expect that trend to be even sharper than the one that began in October.
I have also provided a 4H chart this week as there is a lot more clarity here on the potential bottom formation. We can see that price broke below the support at $50,300, printing a 4H swing-failure (as well as the daily SFP), whilst printing a low around $47,470. Following the reversal back into $51,400, price consolidated and then – very late on Sunday night – sharply swept that $47,470 low into $47,040 and reversed hard for the next 8 hours into $53k, closing above $51,400 and confirming a market structure reversal on this time-frame (higher-high after the sweep of the lows). It is likely that this $53,200 prior support will provide some resistance on this first test, but if we can form a higher-low above $50k, that would indicate accept back above that crucial swing-low and the likelihood of a reversal towards at least $55,200. If you look back at late February, a similar bottoming formation was printed with bullish divergence, where the consolidation cluster that preceded the final dump into the 200MA at $43,125 was flipped as support at $47k, which led to trend continuation. This is why it is important to hold above $50k this week following today’s sharp reversal, as that consolidated that led to the sweep of the low should now be support; if we lose it, it is likely that $47k will also be taken out and subsequently it will depend upon the daily close to determine whether that was the final flush or continuation down towards $43k.
Ethereum:
ETH/USD
Weekly:

Daily:

ETH/BTC
Weekly:

Daily:

Price: $2,445 (0.04635 BTC)
Market Cap: $282.25bn
Thoughts: If Bitcoin had a volatile week, Ethereum’s was on another level.
Beginning with ETH/USD, we can see that last week printed a new all-time high at $2647 but ultimately closed back below the previous week’s high but again at another all-time high for the weekly close ($2322). Quite clearly, the pair wants to be pushing higher, as is evidenced by ETH/BTC, but BTC/USD is dragging it down. That said, for the third consecutive week we have seen higher volume on a push for new all-time highs, which is promising. Further, trendline support that has held firm throughout 2021 remains intact. All in all, the picture remains bullish regardless of BTC/USD, and if BTC is putting in a bottom above $47k, then ETH/USD is likely to push on for $2800 from here this week. Dropping into the daily, we can see just how volatile the week was for the pair, with support holding on Monday around $2050 (prior resistance), catapulting price to a new all-time high at $2647 on Thursday; that is, until BTC/USD began to sell off, printing a daily swing-failure of the all-time high and turning a bullish breakout into rejection. Price then dumped throughout Friday but crucially printed a higher-low, with $2050 again holding as support. Since, we have seen the pair push on again, now trading back into resistance at $2520. If the pair can close the daily above $2520 this week, I’d expect an all-time high to follow and for $2800 to be the next area to act as resistance. Reject here below $2520, however, and it is likely we see trendline support tested this week, along with that $2050 level; lose that on the third test and we are likely going to see $1920 swept.
Turning to ETH/BTC, last week was another monstrously strong week, with the pair printing new yearly highs and closing at a fifth consecutive macro higher-high, confirming the uptrend is very much alive. If we look at the weekly, we can see that volume was higher for the third consecutive week too, confirming the strength of the trend, with price hitting 0.0482 before closing around 0.0473. Right above, we can see that there may be some channel resistance from the previous two peaks, but ultimately I am expecting 0.053 to be tagged before any protracted consolidation takes place. Looking at the daily, there isn’t a great deal to add here, except that daily RSI still has some room to the upside before reaching the extremely overbought conditions of February 2020 or July 2020, and if we can get a daily close above last week’s high at 0.0482 I believe that will trigger the push into 0.053, which has been the level I have been looking at for a year now as a potential area of significant resistance. If we do hit that area, I’d be expecting another multi-week consolidation to follow to allow the pair to cool off and potentially form another higher low within this multi-year channel before attempting a channel breakout and potential blow-off top in the summer (perhaps before the July EIP-1559 proposal goes live).
XRP:
XRP/USD
Weekly:

Daily:

XRP/BTC
Weekly:

Daily:

Price: $1.16 (2194 satoshis)
Market Cap: $52.733bn
Thoughts: If we begin by looking at XRP/USD, from the weekly we can see that price dumped into support last week, having found resistance around $1.40 for the third consecutive week. The pair sold off below the prior weekly low at $1.13, which sent it tumbling down towards prior resistance at $0.96, which held as support. If we lose last week’s low, I’d be looking at that $0.78 area as an ideal place to buy; however, as mentioned last week, I was looking for $0.96 as the first area to begin building a new long, and following the reaction at that level I have entered a partial position. If we look at the daily, we can see this more clearly, with the pair being capped by trendline resistance since making the yearly high at $1.98, with last Friday forming the weekly low at $0.91 and price bouncing to close back above $1.13. Following that bounce, we saw some consolidation within Friday’s range and I entered some around $1. Regarding entering a full position, I am waiting for a clean break and close above trendline resistance, following which I would look to buy a retest of the $1.13 area, though a perfect retest would likely be front-run. My invalidation here is obviously a daily close below $0.96, at which point I would cut and look for a fresh position around $0.79. If we see that trendline breakout over the next couple of days followed by a higher-low, I would expect to see trend continuation towards $2 and higher.
Turning to XRP/BTC, again, the pair sold off right into the area that I have been waiting for since the breakout above trendline resistance and the cluster of daily MAs. If we look at the weekly, the pair retested the trendline as support last week and held above, and I’d now be looking for continuation towards 4k satoshis. Dropping into the daily, market structure remains bullish, with the pair looking to form a higher-low above the 360dMA at 1900 satoshis. As per the trend-based fib extension, a 100% extension aligns nicely with the 4k satoshi target. If we the pair forms a lower-high, however, and then loses the 360dMA, market structure becomes bearish and I would be out of all XRP positions, expecting further downside.
NEO:
NEO/USD
Weekly:

Daily:

NEO/BTC
Weekly:

Daily:

Price: $86.50 (0.00164 BTC)
Market Cap: $6.101bn
Thoughts: If we begin with NEO/USD, the weekly chart depicts the parabolic nature of the rally since March 2020 (much like the rest of the market), with last week printing a new yearly high at $137, just beyond the 61.8% retracement of the entire bear market, with the pair then selling off into the weekly close back into the 38.2% retracement level at $83. Given that NEO is clearly in a strong uptrend, I consider this a dip-buying opportunity like that which followed the $56 high earlier this year, with continuation expected towards that all-time high at $209. If we look at the daily, the pair has dumped into prior resistance now turned support at $70.60, which I would now expect to hold; lose that level and we will likely see NEO retest the prior range at $56. What I would like to see here – if we get the opportunity – is for price to reclaim $95 and then print a higher-low above $70.60, which would provide an ideal entry for continuation above $138. Daily RSI has also reset significantly, with plenty of room now to push on higher back towards extremely overbought conditions.
Looking at NEO/BTC, this is the more interesting pair in my opinion, as price finds itself having rejected at historical support turned resistance around 0.0022, but having rallied into that resistance on rising volume and now consolidating at reclaimed support around 0.00166. It is likely we see another week or two of consolidation here but if NEO can then break out above 0.0023 for the first time since early 2019 (and then 0.0027 for the first time since late 2018), there is effectively zero strong resistance between there and 0.006, and we may see the pair double rather rapidly. If this does occur, compounding longs on dips until 0.006 is hit would be the play.
Cardano:
ADA/USD
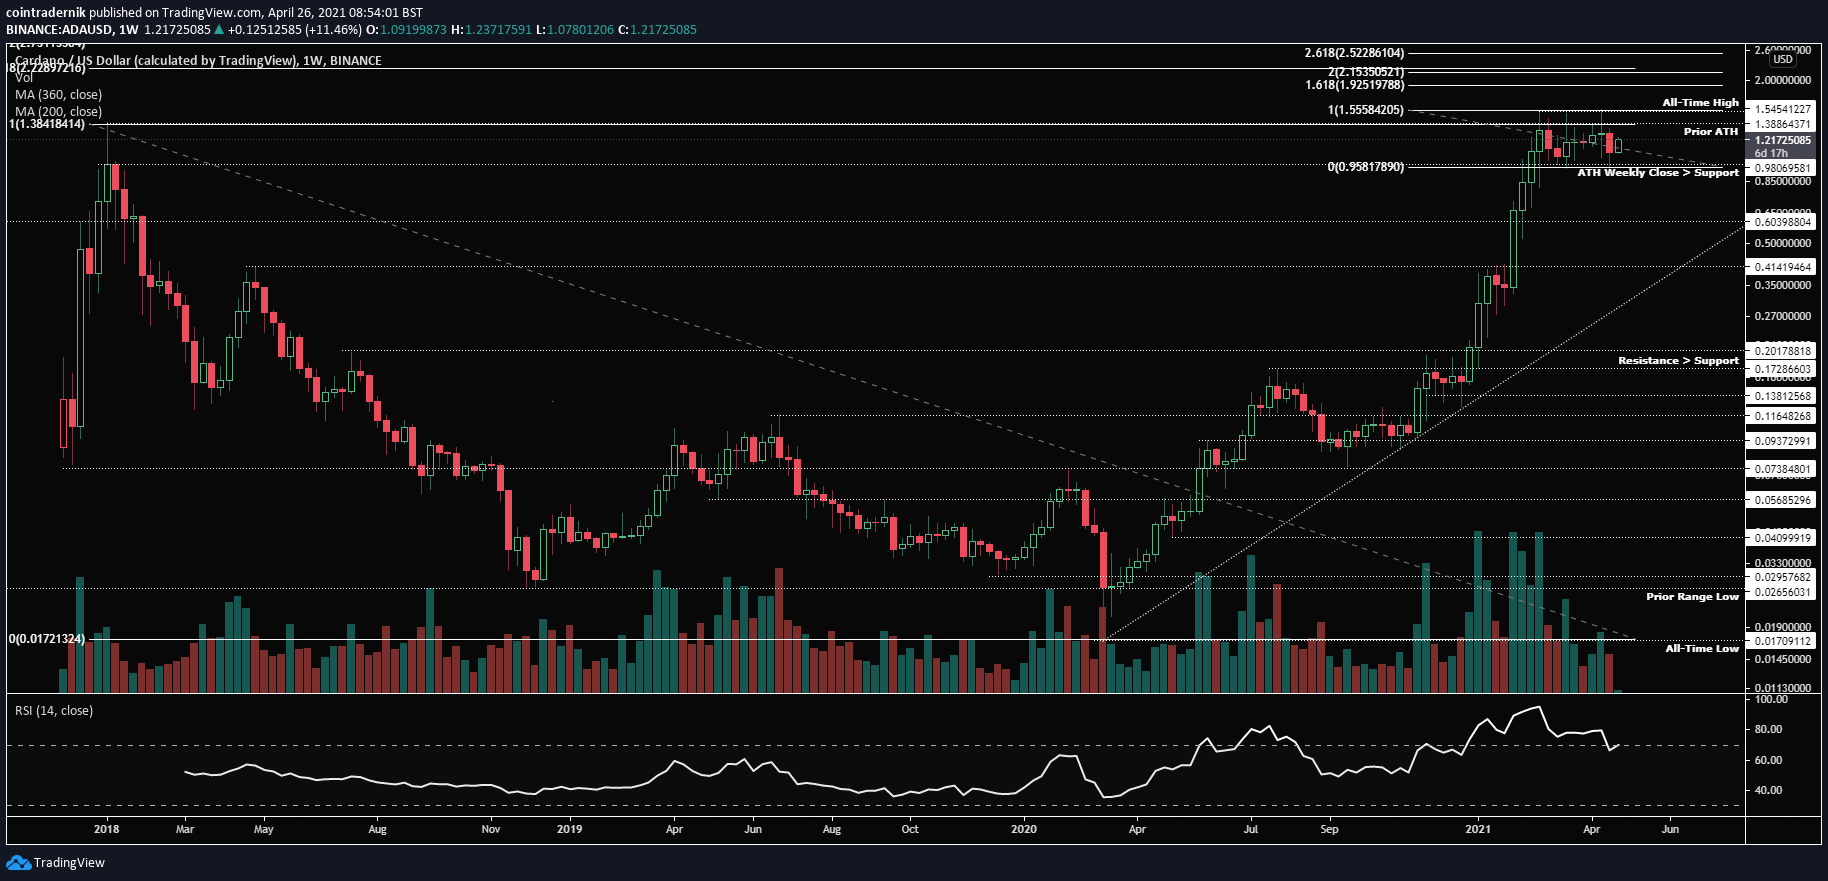
Weekly:
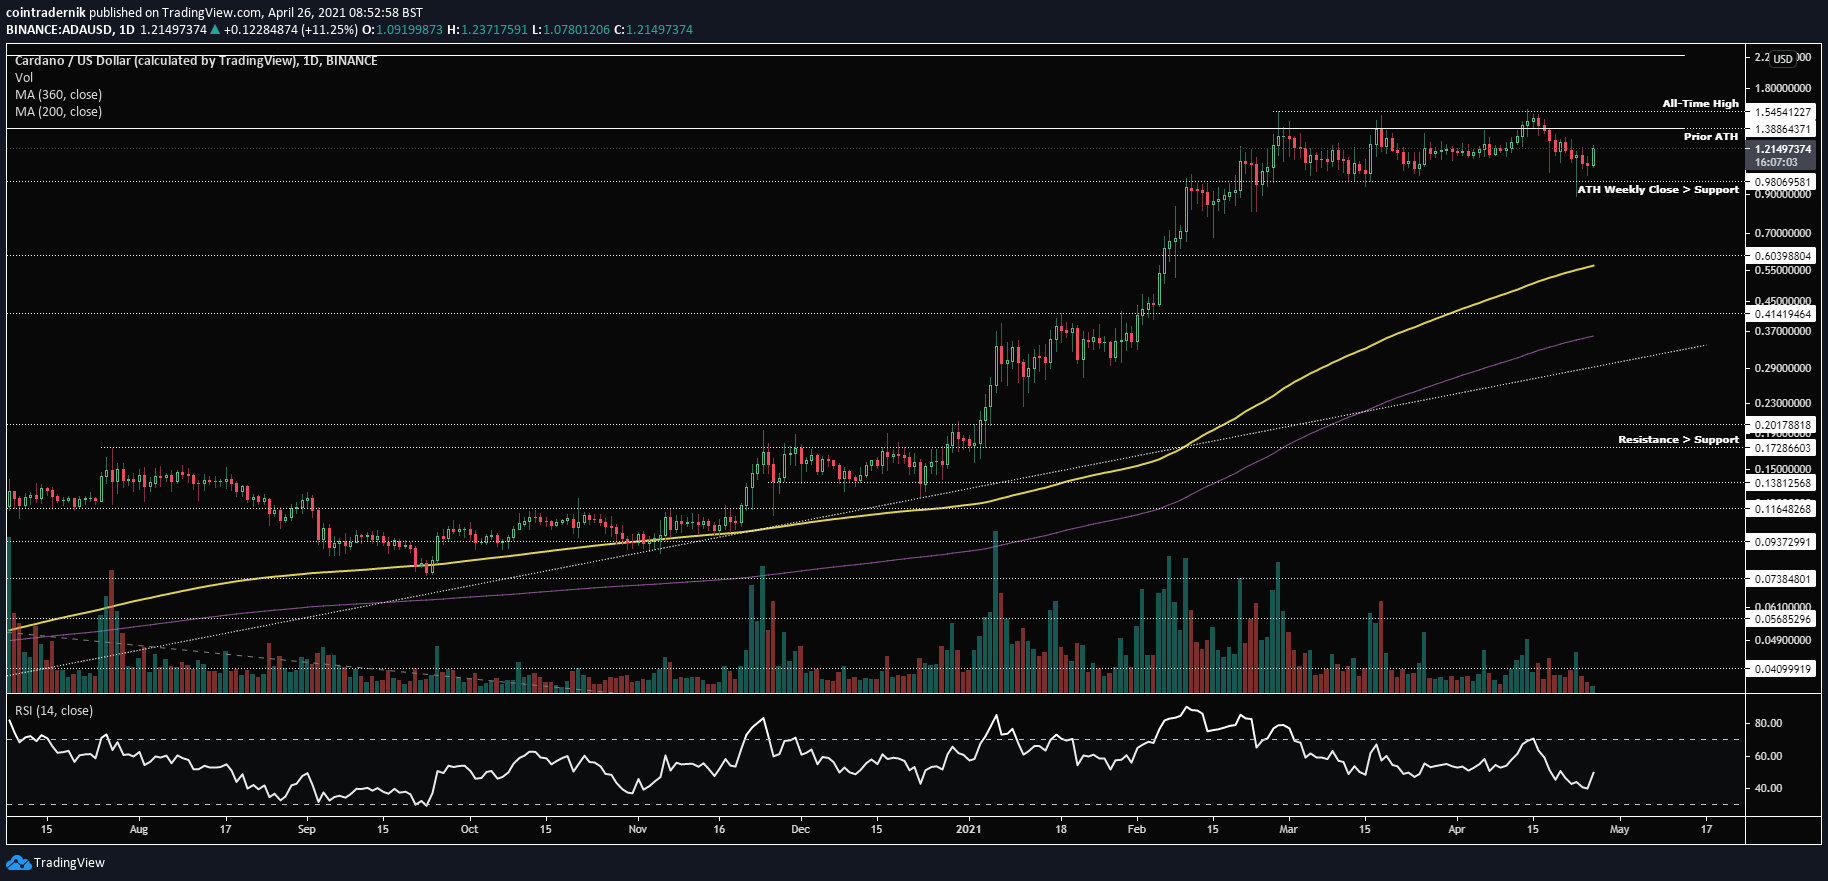
Daily:
ADA/BTC
Weekly:

Daily:
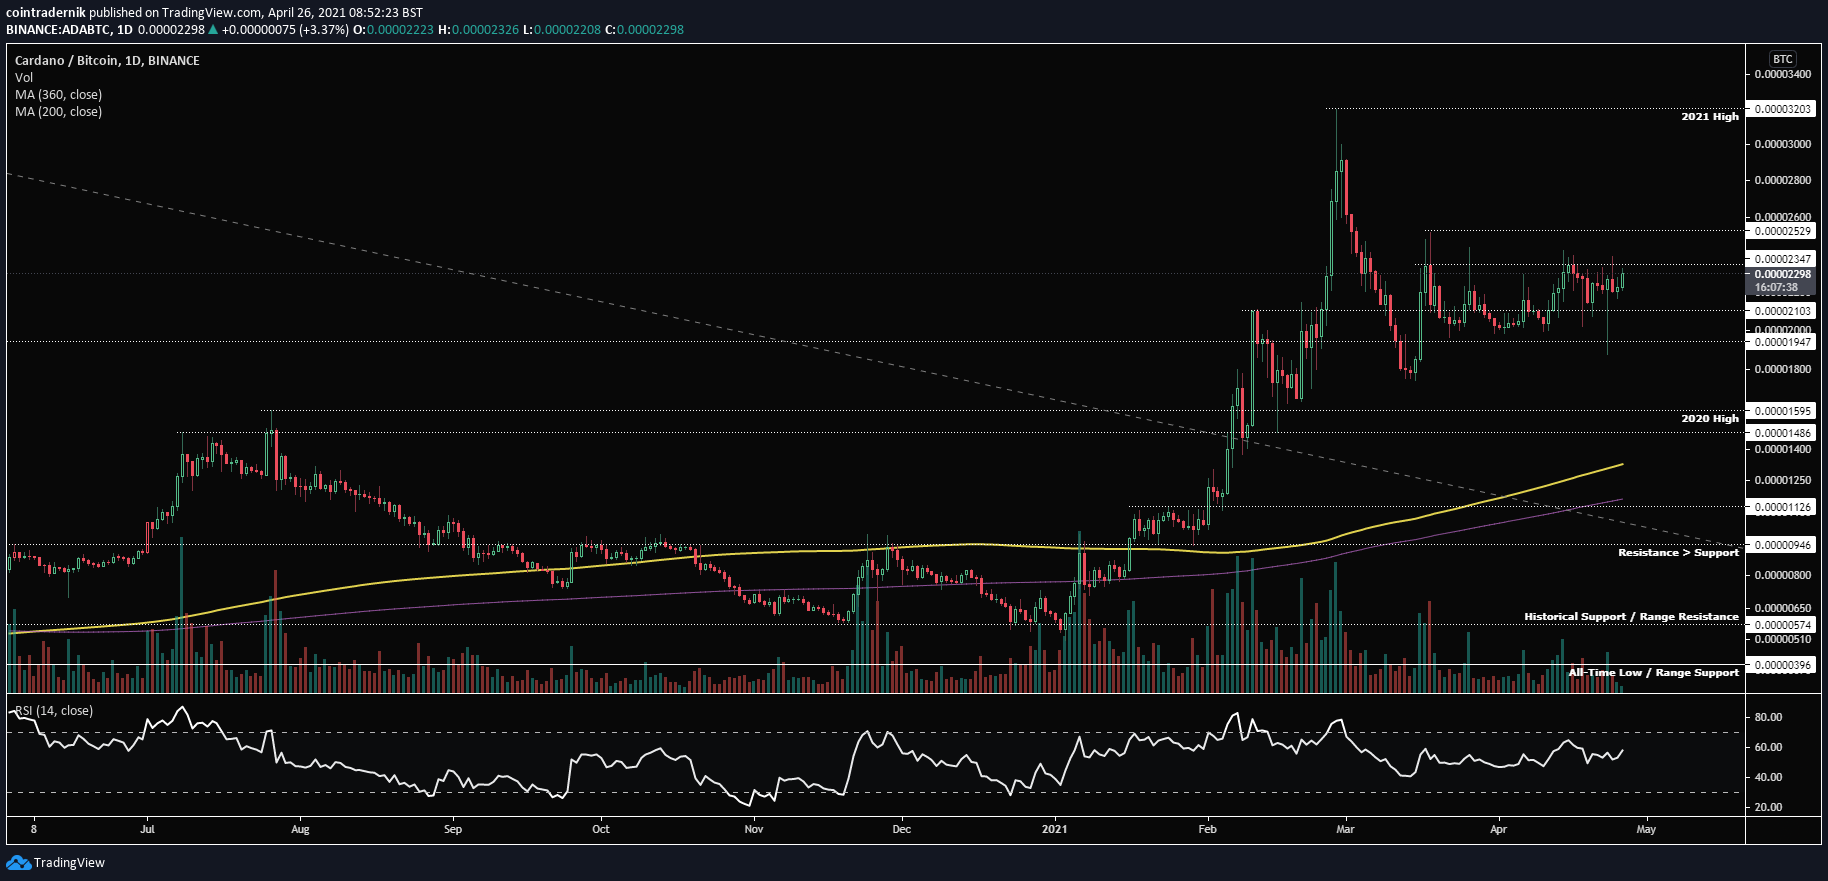
Price: $1.20 (2281 satoshis)
Market Cap: $38.379bn
Thoughts: Cardano is now flagging against the dollar around its all-time highs and may be ready for a move higher.
If we look firstly at ADA/USD, this becomes apparent on the weekly chart, with the pair having failed to close firmly above the prior all-time high at $1.39 on multiple attempts but having printed a new all-time high at $1.54. Meanwhile, it has formed support above the prior all-time high weekly close around $0.98, thus forming a new range. Consolidation under resistance usually leads to expansion higher; of course, this could be a distribution range, but unless we see a weekly close below $0.98, I am expecting this to resolve to the upside and for ADA to become even more over-valued than it currently is, with $2.20 the primary target. Looking at the daily, we can see that RSI has completely reset back towards oversold conditions, and price last week swept the bottom of the range; when one side of a tight range is swept, usually price seeks the other side of the range, which here would be the all-time high around $1.55, where there are three clean highs. As such, I am looking for short-term longs into those highs, looking to buy on whatever dip we get this week, with my invalidation below last week’s low.
Turning to ADA/BTC, the weekly chart shows that price has now been consolidating above prior resistance around 1950 satoshis and below 2550 for several weeks, with weekly RSI now comfortably below extremely overbought conditions. If we see the weekly close above 2550, that would confirm for me that we’re likely going to see expansion towards the April 2018 high at 4237 satoshis. Looking at the daily, unless that mid-March low is low, market structure is still bullish, and a close above 2530 would confirm that it isn’t a complacency high but just a re-accumulation range that we are in at present. If we do get that breakout higher, there is a slightly higher than 1:1 risk/reward play by buying 2530 with a target of 3200 and a stop at 1950, but I’d be focused on playing the dollar pair instead.
Siacoin:
SC/USD
Weekly:

Daily:

SC/BTC
Weekly:

Daily:

Price: $0.034 (65 satoshis)
Market Cap: $1.619bn
Thoughts: Siacoin hit a new yearly high against the dollar a couple of weeks ago but has fallen off since, but trends on both pairs remain intact.
Looking at SC/USD, on the weekly we can see that the pair held below resistance at $0.049 last week, selling off from the weekly open into support at $0.03 and back into trendline support on the parabolic curve. Prior resistance held as support and I’d now like to see the pair continue higher, or risk a longer-term range forming around here before continuation. Looking at the daily, we have bullish divergence on the recent swing-low, and this entire year we have seen prior resistance turn to support and the trend continue, so I am expecting something similar here, with $0.08 my next target for significant resistance. If we do break down below trendline support, however, I’d expect to see re-accumulation occur above $0.0225, but given that last week gave us a near-60% correction from the yearly high, I don’t think the market is going to be more generous than it has been.
Turning to SC/BTC, last week printed an inside week on significantly lower volume, indicating consolidation before expansion. The pair sold off into the 2020 highs turned support around 50 satoshis, which held firm. I fully expect another leg higher from here into 125 satoshis, with the daily chart showing clearly the declining volume on the pull-back into 50 satoshis. If we get another chance to buy 50 satoshis this week, I’ll be taking it, as I missed it last week.
COTI:
COTI/USD
Weekly:

Daily:

COTI/BTC
Weekly:

Daily:

Price: $0.30 (577 satoshis)
Market Cap: $203.575mn
Thoughts: Beginning with COTI/USD, we can see from the weekly that the pair has corrected 63% from the all-time high at $0.58, trading back below channel resistance but holding above prior resistance turned support at $0.233. Trendline resistance continues to cap the pair, but weekly RSI has come off significantly and price looks well placed for a recovery. As mentioned last week, there remains the possibility that we see a 74% retracement like that of late last year before trend continuation, which would take the pair back towards $0.16, but if we can close the weekly above trendline resistance and the channel resistance, I would think that the bottom is in. If we look at the daily for more clarity, I have marked out these two trajectories, with a reclaim of the trendline resistance and channel resistance back into $0.37 likely confirming that $0.23 was the bottom, from which I’d expect continuation towards $0.75. If we reject at this confluence of resistances, however, I would be looking for that 74% retracement similar to last year, back into the 200dMA.
Turning to COTI/BTC, from the weekly we can see that 450 satoshis has held as support for two consecutive weeks now, aligning with the 61.8% retracement of the entire rally; this again would be a reasonable area for a bottom to form prior to another leg higher, providing confluence for the dollar pair. If we look at the daily, price has broken above trendline resistance and is now consolidating below 643 satoshis; a daily close above this level would confirm the bottom for me and I’d be looking for new all-time highs above 1300 satoshis to follow. If 450 satoshis fails to hold as support, however, I’d expect that 300-satoshi prior range resistance to be retested as support, which would provide a great buying opportunity.
VIDT Datalink:
VIDT/USD
Weekly:

Daily:

VIDT/BTC
Weekly:

Daily:
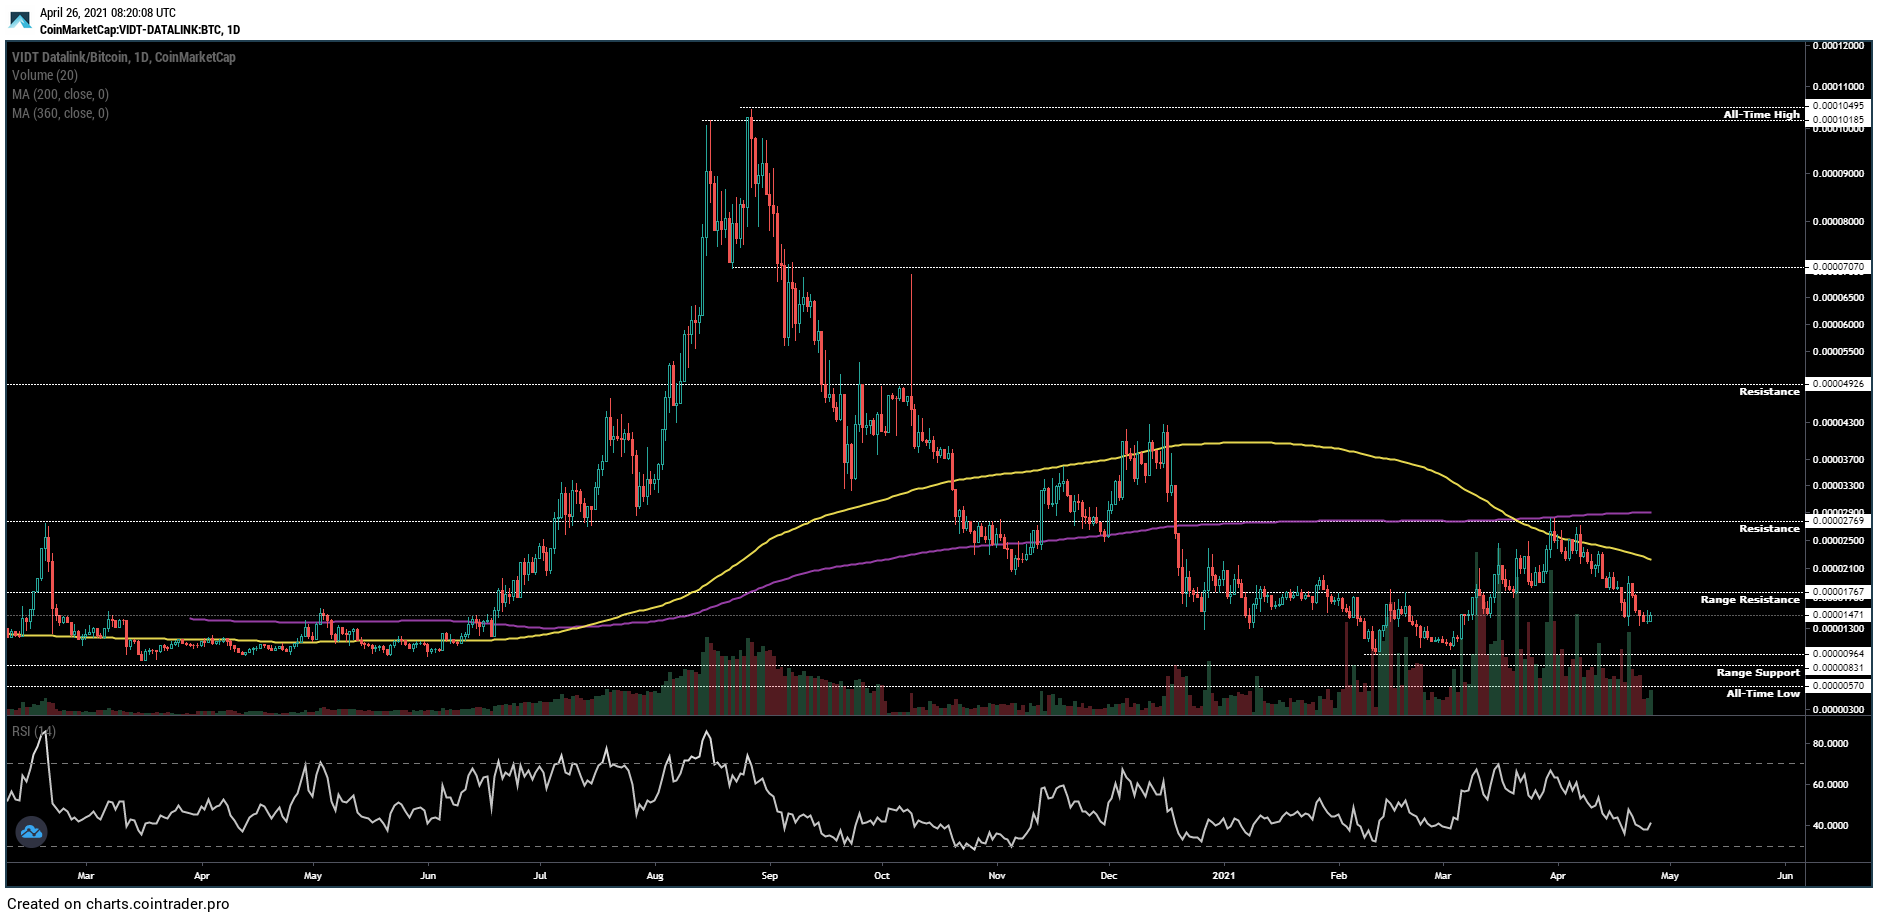
Price: $0.78 (1474 satoshis)
Market Cap: $38.298mn
Thoughts: If we look at VIDT/USD, from the weekly chart, we can see the pair broke out above resistance at $0.77 in March, rallied to new all-time highs at $1.68 and has since returned to retest the breakout area as well as trendline support from November. I would expect to see this support area now hold, with some further consolidation here and the formation of another higher-low before a run to a new all-time high. Unless the trendline support is lost and thus a lower-low forms below $0.55, VIDT remains in a bull market. Looking at the daily, price has returned to the 200dMA, which has largely supported the trend since October, with bottoms forming somewhere between the 200dMA and 360dMA throughout this range. If the pair can break higher from here and reclaim $0.97, from there I would be looking for a move into $2.
Looking at VIDT/BTC, this is one of the few charts that looks to be providing a real opportunity, with most alts having moved away from their accumulation ranges months ago. VIDT has spent the past few months range-bound between resistance at 2770 and support at 960, which aligns roughly with the range that preceded the 2020 cycle into the all-time high at 10.5k satoshis. As price returns to the bottom end of this range, I am looking to buy more VIDT, with my first target at the June 2019 cycle high around 4900 satoshis.
Ferrum Network:
FRM/USD
Weekly:

Daily:

FRM/BTC
Weekly:

Daily:
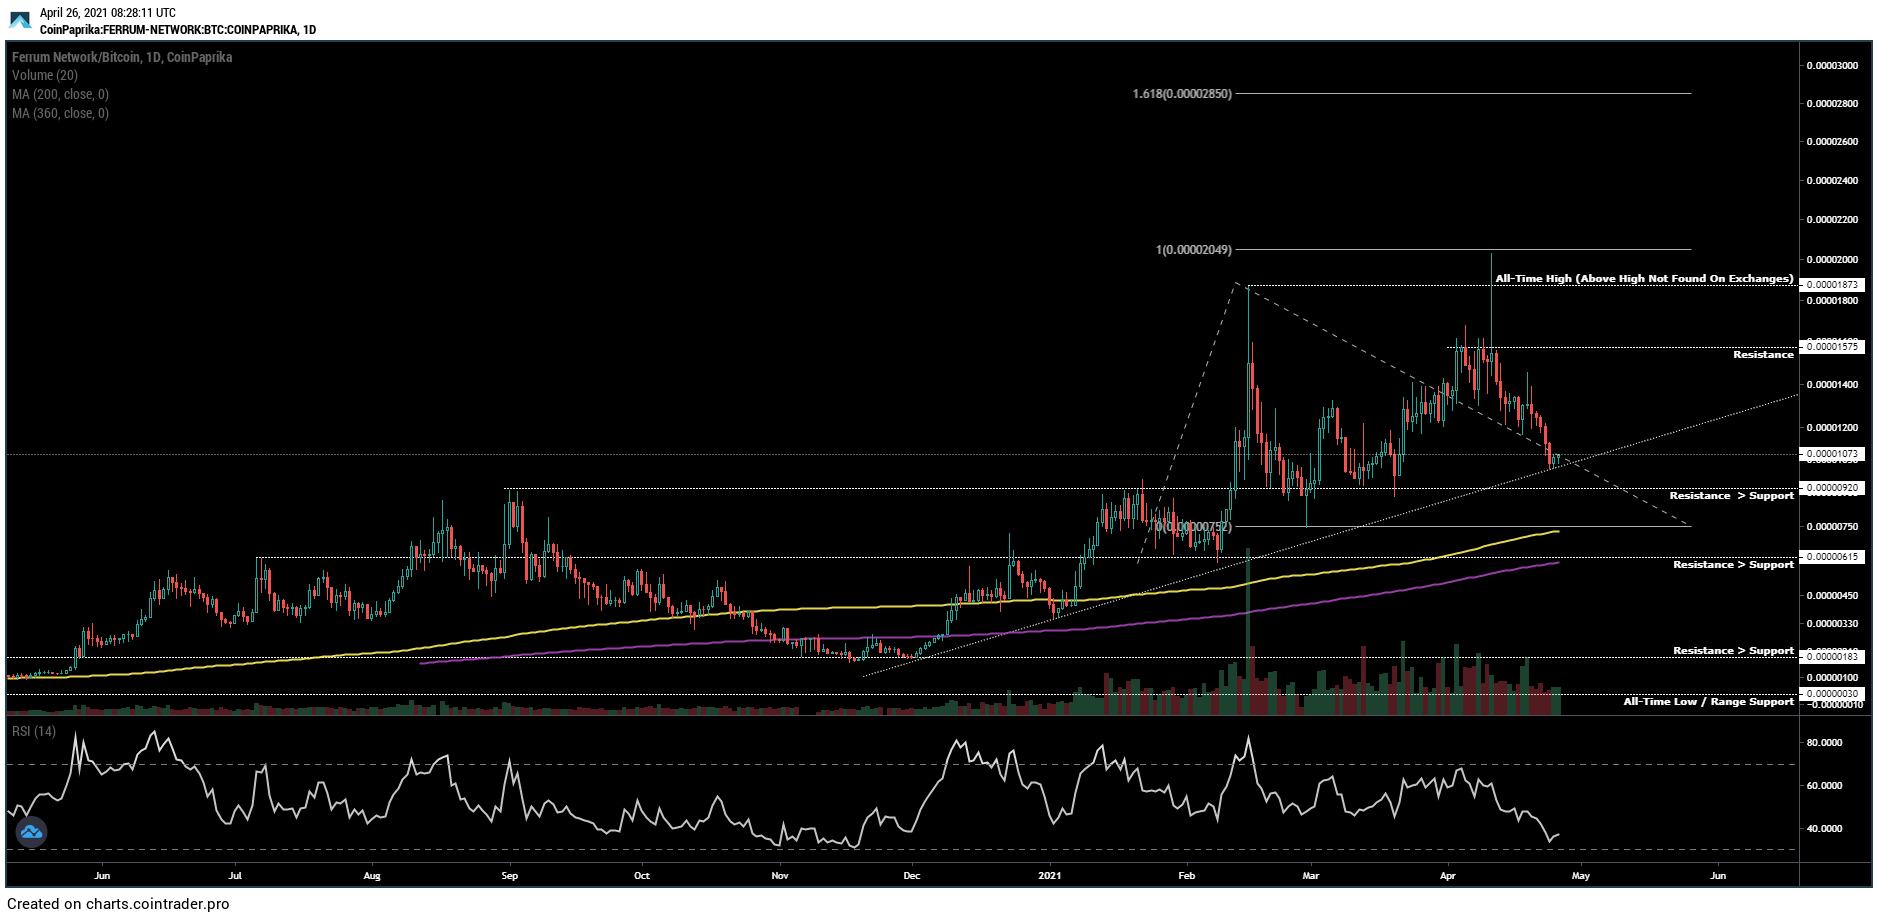
Price: $0.57 (1087 satoshis)
Market Cap: $86.97mn
Thoughts: Ferrum has been in an uptrend since its inception and that does not look like ending just yet.
Looking at FRM/USD, we can see that price has come off since printing an all-time high above $1 ($1.23 is a glitch on the chart, as I can’t see it on any exchanges), with resistance forming around $0.91. That latter level is key here, as price looks to form another macro higher-low above the resistance turned support at $0.33. If we see this higher-low form, no doubt $0.91 will be retested; if the weekly can close above it for the first time in history. that will be the signal for trend continuation towards $1.45. If we look at the daily, there is the possibility that the pair returns to the 200dMA at $0.33 before putting into a bottom, but support here at $0.51 seems to be holding well and I’d like to see a strong bounce from here to show the health of the trend (the previous three higher-lows did not return to the 200dMA). RSI has also entirely reset, now at historically low levels in extremely oversold conditions. Onwards and upwards.
Turning to FRM/BTC, from the weekly we can see that the pair is in a strong uptrend, with price last week having dumped into trendline support, above prior resistance turned support at 920 satoshis. Whilst the pair remains above 920, I fully expect its trend to continue; lose 920 and I’d be concerned, as that was the prior cycle high and has been the launchpad for the most recent all-time high. Looking at the daily, again the pair has returned to oversold conditions on RSI, and if we can form a higher-low here above the trendline I’d be expecting a retest of 1900 satoshis at the very least. Close the daily above 1900 and I think FRM pushes on for the 1.618 extension of the trend at 2850 satoshis.
Cindicator:
CND/USD
Weekly:

Daily:

CND/BTC
Weekly:

Daily:

Price: $0.033 (63 satoshis)
Market Cap: $66.283mn
Thoughts: Cindicator was a request from a reader and I am very glad they requested it, as it appears primed for further upside.
Looking at CND/USD, we can see the pair broke out above significant resistance at $0.022 and rallied into prior support turned resistance at $0.057 over the past few weeks, having since sold off and returned to near the breakout area. This looks like a textbook throw-back into prior resistance turned support and I am looking to buy spot here, expecting trend continuation into the $0.10 area, which I would imagine will provide significant resistance on the first test.
Looking at CND/BTC, the most recent price-action is barely visible on the weekly chart due to the extent of its 2018 bull cycle, but the pair is trading a few multiples above its all-time low at 16 satoshis. If we drop into the daily for clarity, we can see that the previous all-time low at 40 satoshis from May 2020 was swept in January into 16 and then reclaimed in February; a textbook pattern for a run to the high that preceded the low, in this case 150 satoshis. At present, the pair is sitting at support on the 200dMA, which is a great entry point, although the significant sell volume a little over a week ago is a little concerning and I will have to look into that on the rich-list before making a decision. Nonetheless, from a TA perspective, an entry here with a stop loss on a daily close back below 40 with a target of 150 looks good to me.
And that concludes this week’s Market Outlook.
I hope you’ve found some value in the read and thank you for supporting my work!
As ever, feel free to leave any comments or questions below, or email me directly at nik@altcointradershandbook.com.


Just joined. Love it! If possible, can you please cover energy web token in your next report (EWT). Thank you.
No problem, will do.
Hi Nik! Could you cover MATIC or NKN next week? I’m really curious to hear your thoughts about these! Thanks!
Absolutely.
Hey yo Nik, thanks for helping us out with your thoughts on the market – as always. They help loads. I was wondering if you could add Swipe (SXP) to the list of requests for the next one? Thanking you in advance!
No problem!
Great work. Any chance you’d be willing to cast your eye over Vertcoin and share your views?
Will do!
Hey Nic,
Thanks for the update. It’s been a whirl wind of a week. Next week could you cover Mirror Protocol, BarnBridge or Utrust? Thanks!
No problem – will do.